Mastering PostgreSQL Log Management: A Comprehensive Guide
In the dynamic world of databases, PostgreSQL stands out for its robust features and flexibility. However, managing PostgreSQL effectively requires more than just basic configurations—especially when it comes to logs. PostgreSQL logs are a critical component for maintaining the health, performance, and security of your database. They provide deep insights into database activity, helping to identify issues before they become critical.
What Are PostgreSQL Logs?
PostgreSQL logs are records of the database server’s activity, errors, and system messages. These logs provide detailed information about database operations and are essential for monitoring, debugging, and auditing. They capture a wide range of data, including:
- Connection attempts and disconnections
- SQL queries executed
- Errors and warnings
- Checkpoints and autovacuum operations
- Configuration changes
Why PostgreSQL Logs Matter
PostgreSQL logs are invaluable in several key scenarios:
Debugging and Troubleshooting
Logs help identify and resolve issues by providing detailed error messages and the context in which errors occur. They are crucial for diagnosing problems in SQL queries, connection issues, and performance bottlenecks.
Performance Monitoring
By analyzing logs, you can monitor database performance, detect slow queries, and identify areas for optimization.
Security Auditing
Logs help track unauthorized access attempts, monitor user activities, and ensure compliance with security policies.
System Health Monitoring
Logs provide insights into the overall health of the database system, configuration changes, and system events.
Understanding PostgreSQL Log Severity Levels
PostgreSQL categorizes log messages by their importance using severity levels, helping administrators prioritize and address issues effectively:
- DEBUG: Detailed information useful for diagnosing problems, often used during development or troubleshooting
- INFO: General informational messages about system activities and routine operations
- NOTICE: Notifications about significant events that aren’t errors but may be of interest, such as configuration changes
- WARNING: Indicates potential issues that aren’t critical but could lead to problems if not addressed
- ERROR: Reports errors affecting SQL statement or transaction execution, requiring immediate attention
- LOG: General log messages for system events that aren’t errors or warnings but remain important
- FATAL: Critical errors causing database session termination, indicating severe issues needing urgent resolution
- PANIC: The highest severity level, indicating catastrophic failures resulting in immediate database server shutdown to prevent data corruption
Configuring Log Verbosity
PostgreSQL log verbosity refers to the amount of detail included in log messages. By configuring verbosity settings, administrators can control information capture while balancing detailed diagnostics with performance considerations.
Key Log Configuration Parameters
log_min_messages
Sets the minimum message severity level to be logged. Possible values include:
DEBUG5, DEBUG4, DEBUG3, DEBUG2, DEBUG1, INFO, NOTICE, WARNING, ERROR, LOG, FATAL, and PANIC.
log_error_verbosity
Controls the verbosity of logged error messages:
- TERSE: Provides minimal information, useful for reducing log size
- DEFAULT: Includes error message and details, suitable for most use cases
- VERBOSE: Adds extra information such as source code location, useful for debugging
log_statement
Determines which SQL statements are logged:
- none: No statements logged
- ddl: Data definition statements only
- mod: Modification statements
- all: All statements
Essential Log Configuration Parameters
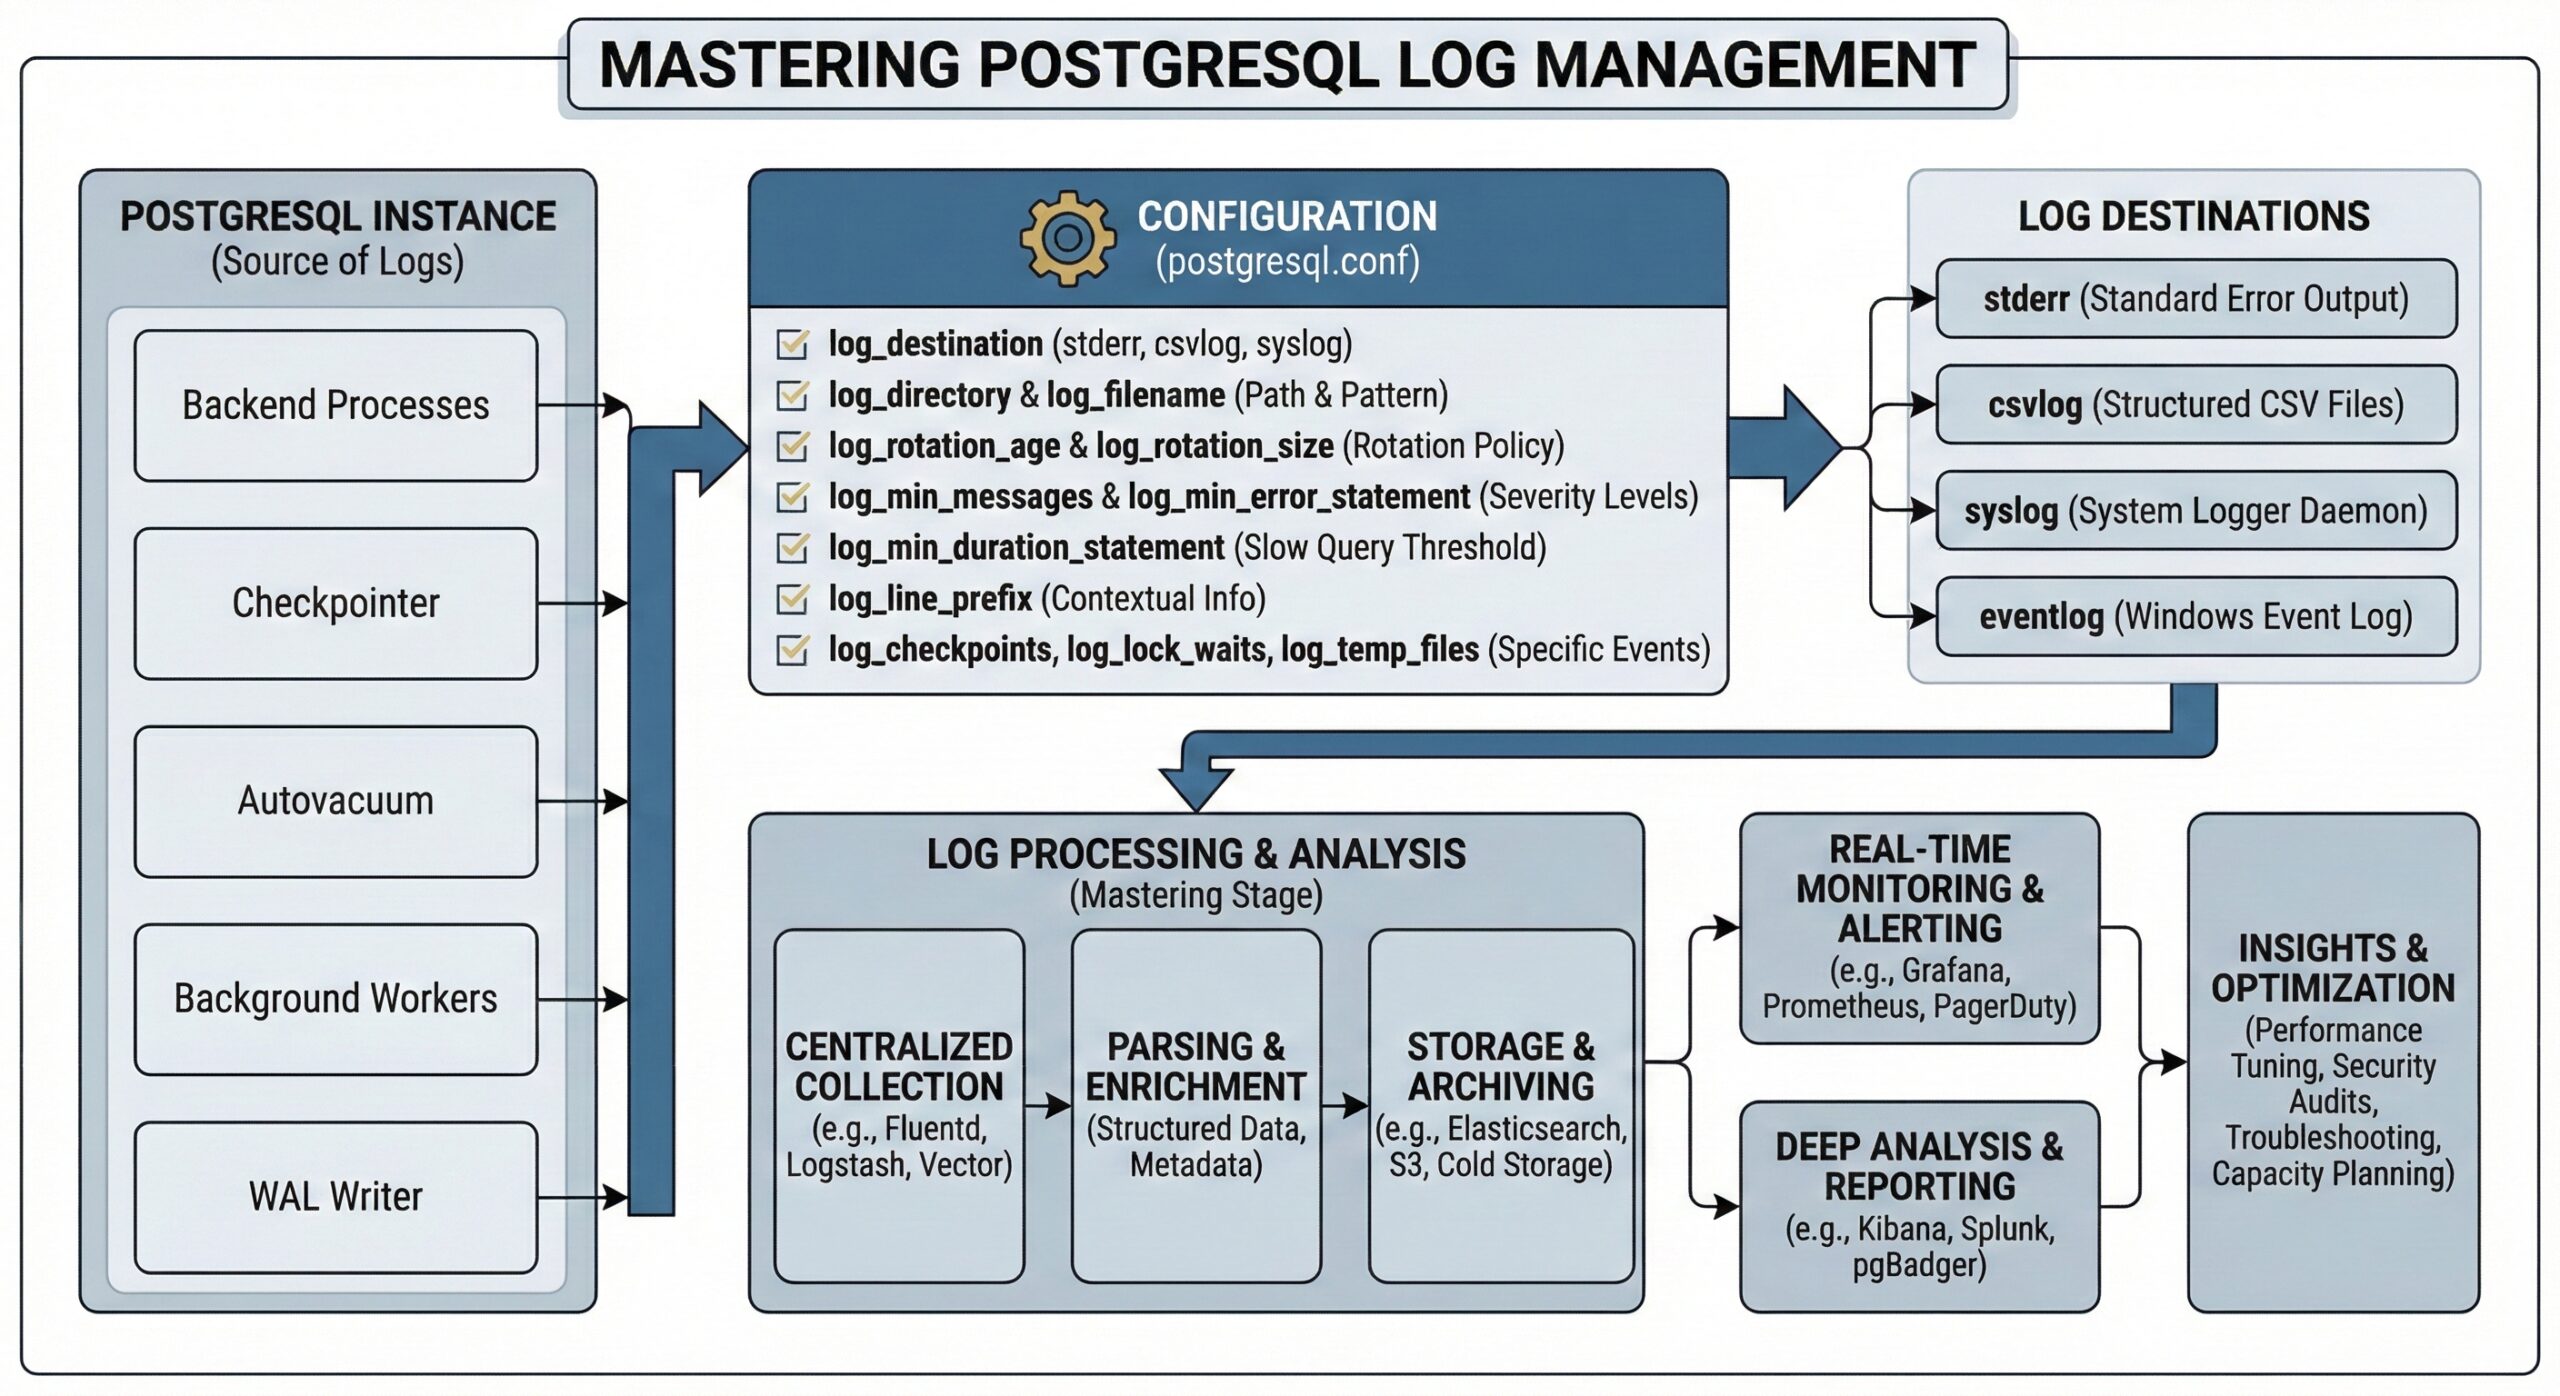
To effectively manage PostgreSQL logs, configure these key parameters in your postgresql.conf file:
-- Basic logging configuration
logging_collector = on
log_directory = 'log'
log_filename = 'postgresql-%Y-%m-%d_%H%M%S.log'
log_file_mode = 0600

-- Log rotation settings
log_rotation_age = 1d
log_rotation_size = 100MB
log_truncate_on_rotation = off

-- What to log
log_min_messages = warning
log_min_error_statement = error
log_min_duration_statement = 1000  -- Log queries taking > 1 second

-- Connection logging
log_connections = on
log_disconnections = on
log_hostname = off

-- Statement logging
log_statement = 'none'  -- or 'ddl', 'mod', 'all'
log_duration = off
log_line_prefix = '%t [%p]: [%l-1] user=%u,db=%d,app=%a,client=%h '

-- Lock and checkpoint logging
log_lock_waits = on
log_checkpoints = on
log_autovacuum_min_duration = 0
Advanced Logging Strategies
Performance-Focused Logging
For performance monitoring, configure these settings:
-- Track slow queries
log_min_duration_statement = 500
log_statement_stats = on
track_activity_query_size = 2048

-- Monitor locks and waits
log_lock_waits = on
deadlock_timeout = 1s

-- Autovacuum monitoring
log_autovacuum_min_duration = 250
Security-Focused Logging
For security auditing, implement these configurations:
-- Connection monitoring
log_connections = on
log_disconnections = on
log_hostname = on

-- Failed connection attempts
log_min_messages = info

-- Statement logging for sensitive operations
log_statement = 'ddl'  -- or 'mod' for data modifications
Log Analysis and Monitoring
Using pgBadger for Log Analysis
pgBadger is a powerful PostgreSQL log analyzer that generates detailed HTML reports:
# Install pgBadger
sudo apt-get install pgbadger

# Generate report
pgbadger /var/log/postgresql/postgresql-*.log -o report.html
Log Monitoring with Scripts
Create automated monitoring scripts to watch for critical events:
#!/bin/bash
# Monitor for FATAL and PANIC messages
tail -f /var/log/postgresql/postgresql-*.log | grep -E "(FATAL|PANIC)" | \
while read line; do
    echo "CRITICAL: $line" | mail -s "PostgreSQL Alert" admin@company.com
done
Best Practices for Log Management
1. Balance Detail with Performance
- Use appropriate log levels to avoid overwhelming the system
- Monitor log file sizes and implement proper rotation
- Consider using asynchronous logging for high-traffic systems
2. Implement Log Rotation
Configure automatic log rotation to prevent disk space issues:
log_rotation_age = 1d
log_rotation_size = 100MB
log_truncate_on_rotation = off
3. Secure Your Logs
- Set appropriate file permissions (log_file_mode = 0600)
- Store logs in secure locations
- Consider encrypting sensitive log data
4. Regular Log Analysis
- Implement automated log analysis tools
- Set up alerts for critical events
- Regularly review log patterns for optimization opportunities
5. Archive and Backup Logs
- Implement log archiving strategies
- Include logs in backup procedures
- Consider compliance requirements for log retention
Troubleshooting Common Issues
High Log Volume
If logs are growing too quickly:
- Increase log_min_messages to reduce verbosity
- Disable unnecessary logging features
- Implement more aggressive log rotation
Missing Critical Information
If important events aren’t being logged:
- Lower log_min_messages appropriately
- Enable specific logging features (connections, statements, etc.)
- Check log file permissions and disk space
Performance Impact
If logging affects performance:
- Use asynchronous logging where possible
- Optimize log destination (separate disk)
- Consider using log sampling for high-frequency events
Conclusion
Effective PostgreSQL log management is crucial for maintaining a healthy, secure, and performant database environment. By understanding log severity levels, configuring appropriate verbosity settings, and implementing proper monitoring and analysis procedures, you can leverage PostgreSQL logs to their full potential.
Remember that log configuration should be tailored to your specific needs, balancing the requirement for detailed information with system performance considerations. Regular review and adjustment of your logging strategy will ensure you capture the right information while maintaining optimal database performance.
Start with conservative settings and gradually increase verbosity as needed, always monitoring the impact on system performance and storage requirements. With proper log management in place, you’ll have the insights needed to maintain a robust PostgreSQL environment.
Further Reading:
- Useful CQLSH Commands for Everyday Use
- Transparent Data Encryption (TDE): The Ultimate Guide
- Cassandra for Beginners: Understanding Replication
- MongoDB Sharding Best Practices & When to Enable It
- Troubleshooting Fragmented MongoDB Platforms: Expert Guide by MinervaDB Inc.
- PostgreSQL Log Maintenance and Operations