Troubleshooting MySQL Group Replication Performance Bottlenecks: A Technical Deep Dive
MySQL Group Replication (GR) provides native high availability and fault tolerance through synchronous multi-master or single-primary replication. However, its distributed nature introduces unique performance challenges. This comprehensive guide explores systematic approaches to diagnose and resolve Group Replication bottlenecks.
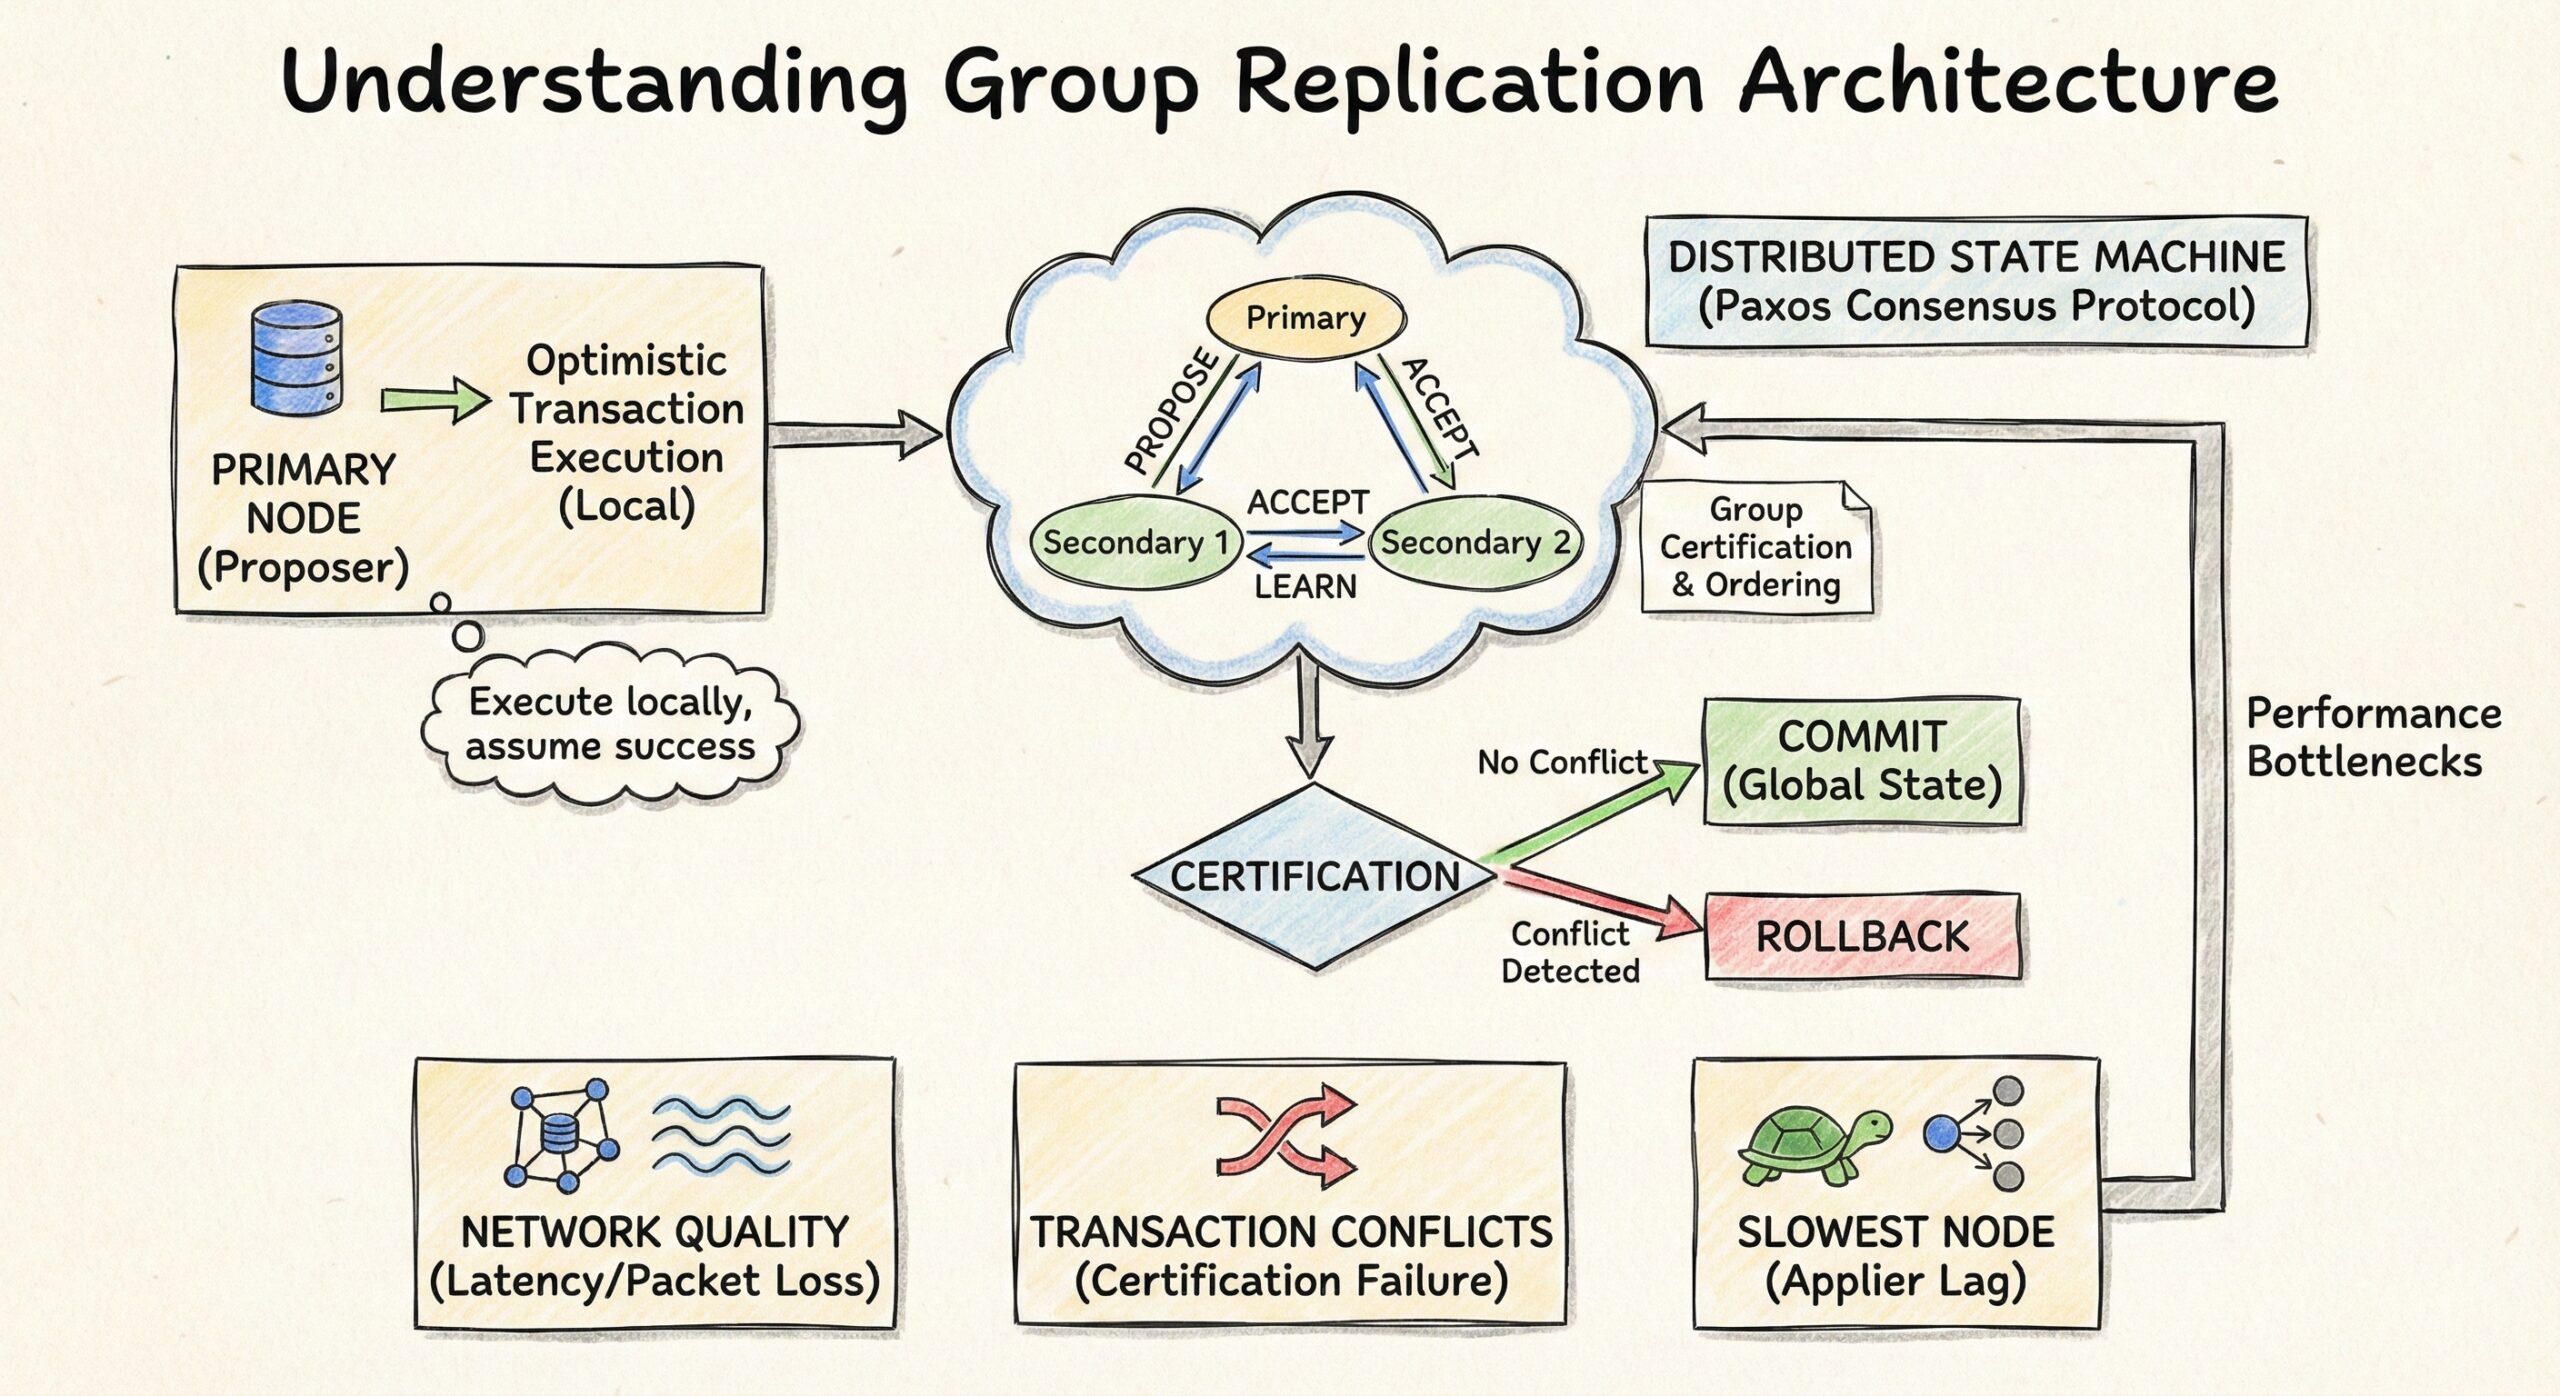
Understanding Group Replication Architecture
Before diving into troubleshooting, it’s essential to understand that Group Replication uses a distributed state machine with optimistic transaction execution. Transactions are executed locally, then certified by the group through a consensus protocol (Paxos-based). This architecture means performance depends heavily on network quality, transaction conflicts, and the slowest node in the group.
1. Analyzing Group Replication Status
Initial Diagnostics
Start with baseline status checks to understand your cluster’s current state:
-- Check overall group replication status
SHOW STATUS LIKE 'group_replication%';

-- Identify active processes and potential locks
SHOW PROCESSLIST;

-- Detailed member statistics
SELECT * FROM performance_schema.replication_group_member_stats\\G
Key Metrics to Monitor
- COUNT_TRANSACTIONS_IN_QUEUE: Indicates applier backlog
- COUNT_TRANSACTIONS_CHECKED: Shows certification activity
- COUNT_CONFLICTS_DETECTED: Reveals transaction collision frequency
- TRANSACTIONS_COMMITTED_ALL_MEMBERS: Tracks successful group commits
High queue counts or increasing conflict rates signal immediate attention areas.
2. Network Latency and Throughput Evaluation
Network performance is the foundation of Group Replication efficiency. Even minor latency increases can cascade into significant bottlenecks.
Measurement Techniques
# Basic latency check between nodes
ping -c 100 <remote_node_ip>

# Throughput testing with iperf3
iperf3 -c <remote_node_ip> -t 60 -P 4

# TCP connection quality
mtr --report <remote_node_ip>
MySQL Internal Metrics
-- Communication statistics
SELECT * FROM performance_schema.replication_group_communication_information;

-- Message delivery times
SELECT * FROM performance_schema.replication_connection_status;
Network Requirements
- Latency: < 5 ms for optimal performance; > 20 ms causes noticeable degradation
- Bandwidth: Minimum 1 Gbps; 10 Gbps recommended for write-heavy workloads
- Packet Loss: Should be < 0.01%
3. Write Throughput and Transaction Conflict Analysis
Group Replication’s optimistic concurrency model means conflicts result in transaction rollbacks—a significant performance penalty.
Conflict Detection
-- Monitor conflict rates per member
SELECT
    member_id,
    COUNT_CONFLICTS_DETECTED,
    COUNT_TRANSACTIONS_ROWS_VALIDATING,
    COUNT_TRANSACTIONS_REMOTE_IN_APPLIER_QUEUE
FROM performance_schema.replication_group_member_stats;

-- Transaction-level conflict analysis
SELECT
    event_name,
    count_star,
    sum_timer_wait/1000000000000 AS total_seconds,
    avg_timer_wait/1000000000000 AS avg_seconds
FROM performance_schema.events_transactions_summary_by_account_by_event_name
WHERE event_name LIKE '%transaction%'
ORDER BY sum_timer_wait DESC;
Conflict Mitigation Strategies
Application-Level Optimization:
- Implement row-level sharding to distribute writes across different data ranges
- Use SELECT … FOR UPDATE judiciously to reduce optimistic lock failures
- Batch related operations within single transactions to reduce certification rounds
- Implement application-level retry logic with exponential backoff
Database Design:
- Avoid auto-increment primary keys in multi-primary mode (use UUIDs or composite keys)
- Partition hot tables to distribute write load
- Minimize foreign key constraints that span frequently updated tables
4. Flow Control and Applier Performance
Flow control is Group Replication’s self-throttling mechanism—when one member falls behind, the entire group slows down to maintain consistency.
Flow Control Monitoring
-- Flow control status variables
SHOW STATUS LIKE 'group_replication_flow_control%';

-- Key metrics:
-- group_replication_flow_control_count: How often throttling occurred
-- group_replication_flow_control_pauses_sum: Total pause time
Configuration Tuning
# my.cnf adjustments
group_replication_flow_control_mode = QUOTA
group_replication_flow_control_certifier_threshold = 25000
group_replication_flow_control_applier_threshold = 25000
group_replication_flow_control_min_quota = 0
group_replication_flow_control_max_quota = 0  # 0 = unlimited
Identifying the Slowest Applier
-- Find which member is lagging
SELECT
    member_id,
    member_host,
    COUNT_TRANSACTIONS_IN_QUEUE,
    COUNT_TRANSACTIONS_REMOTE_IN_APPLIER_QUEUE,
    COUNT_TRANSACTIONS_REMOTE_APPLIED
FROM performance_schema.replication_group_member_stats
ORDER BY COUNT_TRANSACTIONS_IN_QUEUE DESC;
If one member consistently shows high queue counts, investigate its specific resource constraints.
5. Transaction Size Optimization
Large transactions create multiple bottlenecks in Group Replication:
- Increased memory consumption during certification
- Longer group-wide locks
- Higher probability of conflicts
- Larger network message sizes
Best Practices
-- Monitor transaction sizes
SELECT
    digest_text,
    count_star,
    avg_timer_wait/1000000000000 AS avg_seconds,
    sum_rows_affected,
    sum_rows_sent
FROM performance_schema.events_statements_summary_by_digest
WHERE digest_text NOT LIKE '%performance_schema%'
ORDER BY sum_rows_affected DESC
LIMIT 20;
Recommendations:
- Keep transactions under 1000 rows affected when possible
- Break bulk operations into batches of 500-1000 rows
- Use LIMIT clauses in UPDATE/DELETE operations
- Consider pt-online-schema-change for DDL operations
6. InnoDB and System Resource Optimization
InnoDB Configuration
# Critical InnoDB settings for Group Replication
innodb_buffer_pool_size = 70% of available RAM
innodb_log_file_size = 2G  # Larger for write-heavy workloads
innodb_flush_log_at_trx_commit = 1  # Required for ACID compliance
innodb_flush_method = O_DIRECT
innodb_io_capacity = 2000  # Adjust based on storage
innodb_io_capacity_max = 4000
innodb_write_io_threads = 8
innodb_read_io_threads = 8
System Resource Monitoring
# IO performance
iostat -x 5

# CPU utilization
mpstat -P ALL 5

# Memory pressure
vmstat 5

# Disk latency
iotop -o
MySQL Sys Schema Queries
-- Top IO-intensive statements
SELECT * FROM sys.statements_with_runtimes_in_95th_percentile;

-- IO by file
SELECT * FROM sys.io_global_by_file_by_bytes LIMIT 20;

-- Wait event analysis
SELECT * FROM sys.waits_global_by_latency LIMIT 20;
7. Certification and Communication Analysis
Certification is the process where the group validates that a transaction doesn’t conflict with concurrent transactions.
Certification Metrics
-- Certification queue depth
SELECT
    VARIABLE_NAME,
    VARIABLE_VALUE
FROM performance_schema.global_status
WHERE VARIABLE_NAME LIKE '%certification%'
   OR VARIABLE_NAME LIKE '%conflict%';

-- Communication round-trip times
SELECT * FROM performance_schema.replication_group_communication_information;
Reducing Certification Overhead
- Minimize write set size by updating only necessary columns
- Use smaller transaction isolation levels when appropriate (READ COMMITTED vs REPEATABLE READ)
- Implement application-level write coordination in multi-primary setups
8. Error Log Analysis
MySQL error logs provide critical insights into group membership changes, network issues, and replication problems.
Key Patterns to Search
# Group membership changes
grep -i "group replication" /var/log/mysql/error.log | grep -i "member"

# Network-related issues
grep -i "timeout\\|unreachable\\|connection" /var/log/mysql/error.log

# Certification failures
grep -i "certification\\|conflict" /var/log/mysql/error.log
Common Warning Signs
- Frequent member UNREACHABLE states
- Repeated view changes
- “Timeout while waiting for the group communication engine” messages
- Certification database size warnings
9. Version Compatibility and Known Issues
Version Recommendations
- Minimum: MySQL 8.0.27 (significant GR improvements)
- Recommended: MySQL 8.0.35+ or 8.4+ (latest bug fixes and performance enhancements)
Notable Improvements by Version
- 8.0.27: Message compression for Group Replication
- 8.0.29: Improved flow control algorithms
- 8.0.31: Enhanced certification performance
- 8.0.35: Better handling of large transactions
-- Check current version
SELECT VERSION();

-- Verify Group Replication plugin version
SELECT * FROM information_schema.plugins
WHERE plugin_name = 'group_replication'\\G
10. Topology and Geographic Considerations
Geographic Distribution Impact
| Node Separation | Expected Latency | Performance Impact |
|---|---|---|
| Same rack | < 1 ms | Minimal |
| Same datacenter | 1-5 ms | Low |
| Same region | 5-20 ms | Moderate |
| Cross-region | 20-100 ms | Significant |
| Cross-continent | 100-300 ms | Severe |
Optimal Group Size
- Single-Primary: 3-5 nodes (odd number for quorum)
- Multi-Primary: 3 nodes maximum (conflict overhead increases exponentially)
- Read Replicas: Add asynchronous replicas for read scaling instead of expanding the group
11. Essential Tools and Monitoring Stack
Performance Schema Queries
-- Comprehensive replication health check
SELECT
    m.member_id,
    m.member_host,
    m.member_port,
    m.member_state,
    s.COUNT_TRANSACTIONS_IN_QUEUE AS queue_size,
    s.COUNT_CONFLICTS_DETECTED AS conflicts,
    s.COUNT_TRANSACTIONS_REMOTE_IN_APPLIER_QUEUE AS applier_queue
FROM performance_schema.replication_group_members m
JOIN performance_schema.replication_group_member_stats s
    ON m.member_id = s.member_id;
Sys Schema Utilities
-- Statement analysis
SELECT * FROM sys.statement_analysis LIMIT 20;

-- User resource consumption
SELECT * FROM sys.user_summary;

-- Schema statistics
SELECT * FROM sys.schema_table_statistics;
External Tools
- Percona Toolkit: pt-online-schema-change, pt-query-digest, pt-mysql-summary
- Orchestrator: Topology visualization and management
- PMM (Percona Monitoring and Management): Comprehensive monitoring solution
- MySQL Enterprise Monitor: Official monitoring platform
Troubleshooting Checklist
Immediate Actions (< 5 minutes)
[ ] Check group membership status
[ ] Verify all nodes are ONLINE
[ ] Review current processlist for blocking queries
[ ] Check flow control activation frequency
[ ] Examine error logs for recent warnings
Short-term Analysis (< 30 minutes)
[ ] Measure inter-node network latency
[ ] Analyze transaction conflict rates
[ ] Identify slow queries and resource bottlenecks
[ ] Review applier queue depths across members
[ ] Check system resource utilization (CPU, IO, memory)
Long-term Optimization (ongoing)
[ ] Implement application-level write coordination
[ ] Optimize transaction sizes and batching
[ ] Tune InnoDB configuration based on workload
[ ] Establish baseline performance metrics
[ ] Set up proactive monitoring and alerting
[ ] Plan capacity based on growth projections
Proactive Monitoring Strategy
Critical Alerts to Configure
-- Alert when applier queue exceeds threshold
COUNT_TRANSACTIONS_IN_QUEUE > 1000

-- Alert on high conflict rate
COUNT_CONFLICTS_DETECTED / COUNT_TRANSACTIONS_CHECKED > 0.05

-- Alert on flow control activation
group_replication_flow_control_count increasing rapidly

-- Alert on member state changes
member_state != 'ONLINE'
Automation Recommendations
- Automated Health Checks: Run diagnostic queries every 60 seconds
- Capacity Planning: Track growth trends for proactive scaling
- Workload Analysis: Identify hot spots and optimize application queries
- Backup Validation: Ensure backup processes don’t impact replication
- Failover Testing: Regular drills to validate cluster resilience
Conclusion
MySQL Group Replication performance optimization requires a holistic approach combining network infrastructure, database configuration, application design, and continuous monitoring. The most common bottlenecks—network latency, transaction conflicts, and flow control—can be systematically addressed through the methodologies outlined above.
Success with Group Replication depends on:
- Proactive monitoring rather than reactive troubleshooting
- Application-aware design that minimizes write conflicts
- Infrastructure quality with low-latency, high-bandwidth networking
- Regular maintenance including version upgrades and configuration tuning
By implementing these strategies and maintaining vigilant oversight of your Group Replication cluster, you can achieve both high availability and consistent performance for your MySQL infrastructure.