MariaDB Performance Troubleshooting: Complete 2026 Guide to Database Optimization
Meta Description: Master MariaDB performance troubleshooting with our comprehensive 2026 guide. Learn query optimization, indexing strategies, and advanced diagnostic techniques to boost database speed by up to 300%.
Keywords: MariaDB performance, database optimization, query troubleshooting, MySQL vs MariaDB, database tuning, SQL performance, InnoDB optimization
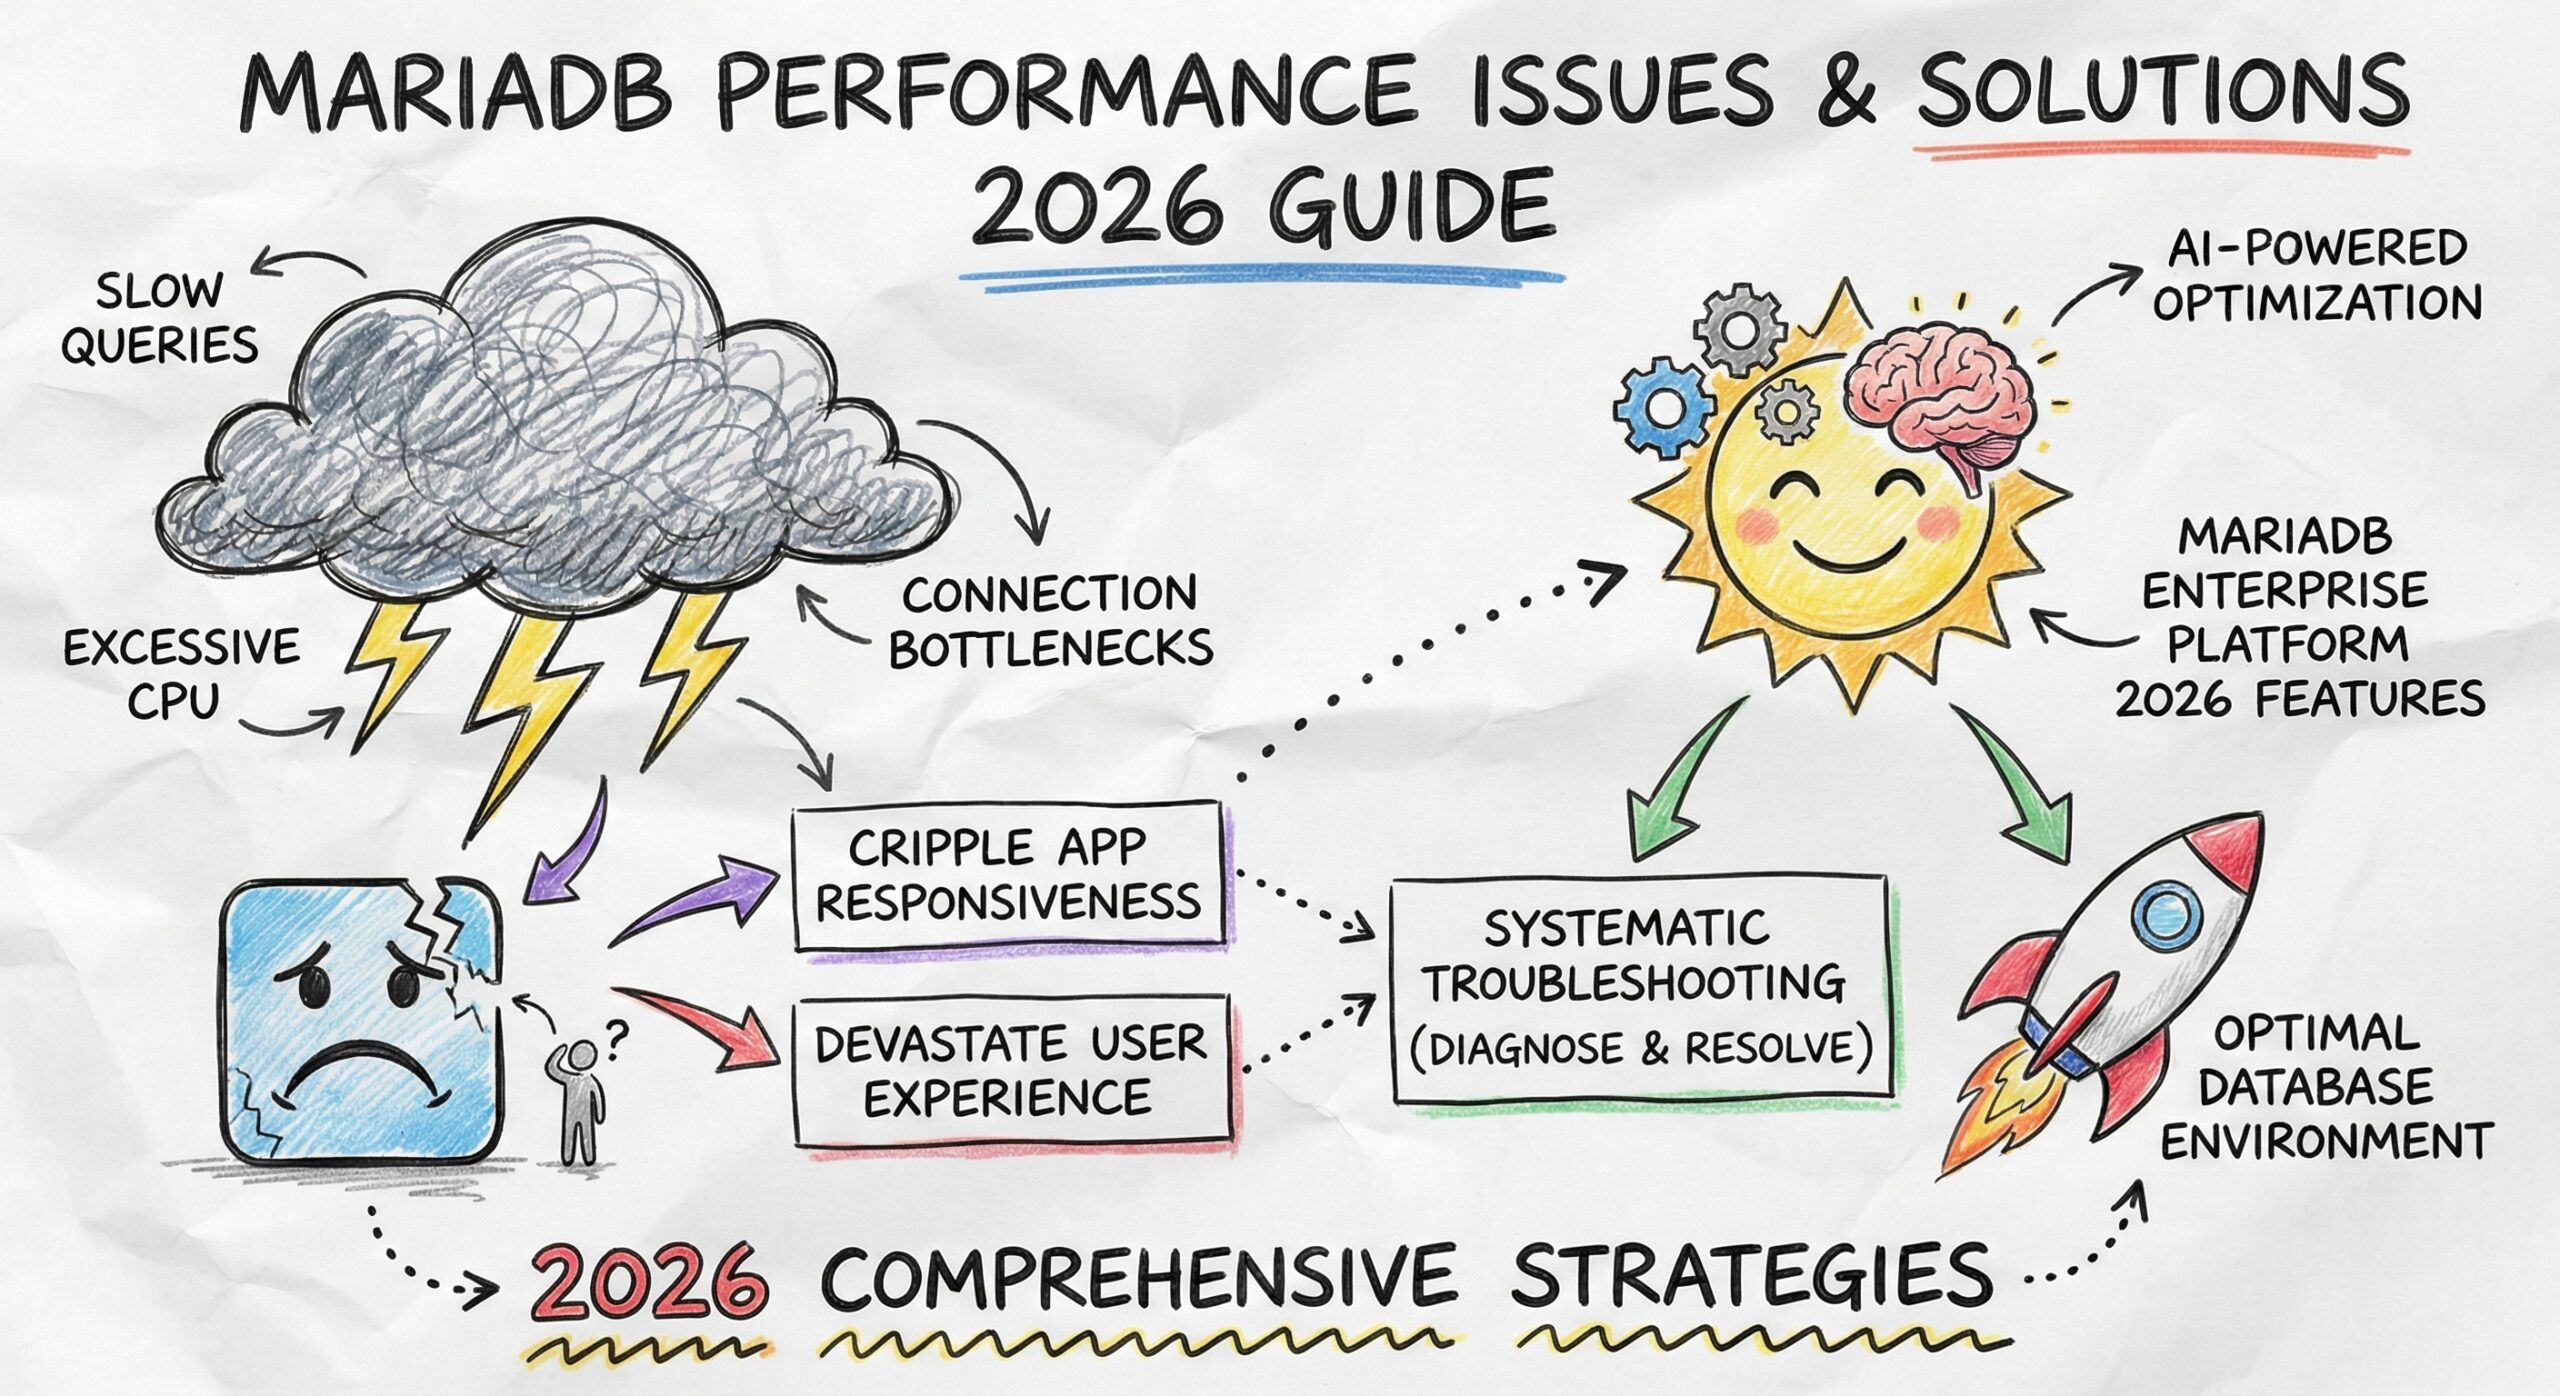
MariaDB performance issues can cripple application responsiveness and devastate user experience in today’s data-driven landscape. Whether you’re battling slow queries, excessive CPU usage, or connection bottlenecks, mastering systematic troubleshooting approaches is crucial for maintaining optimal database environments. This comprehensive 2026 guide provides cutting-edge strategies to diagnose and resolve MariaDB performance challenges, incorporating the latest AI-powered optimization techniques and MariaDB Enterprise Platform 2026 features.
Understanding MariaDB Performance Bottlenecks in 2026
Database performance degradation typically originates from several critical areas that have evolved with modern workloads:
Primary Performance Killers:
- Inefficient queries consuming excessive computational resources
- Suboptimal server configuration misaligned with workload requirements
- Missing or poorly designed indexes forcing costly full table scans
- Insufficient memory allocation triggering excessive disk I/O overhead
- Hardware limitations constraining database operations
- Legacy configuration settings incompatible with modern MariaDB versions
Modern Challenges:
With MariaDB’s enhanced performance capabilities compared to MySQL, organizations often underestimate configuration requirements, leading to suboptimal performance despite superior underlying technology.
Advanced Performance Issue Identification
Critical Warning Signs
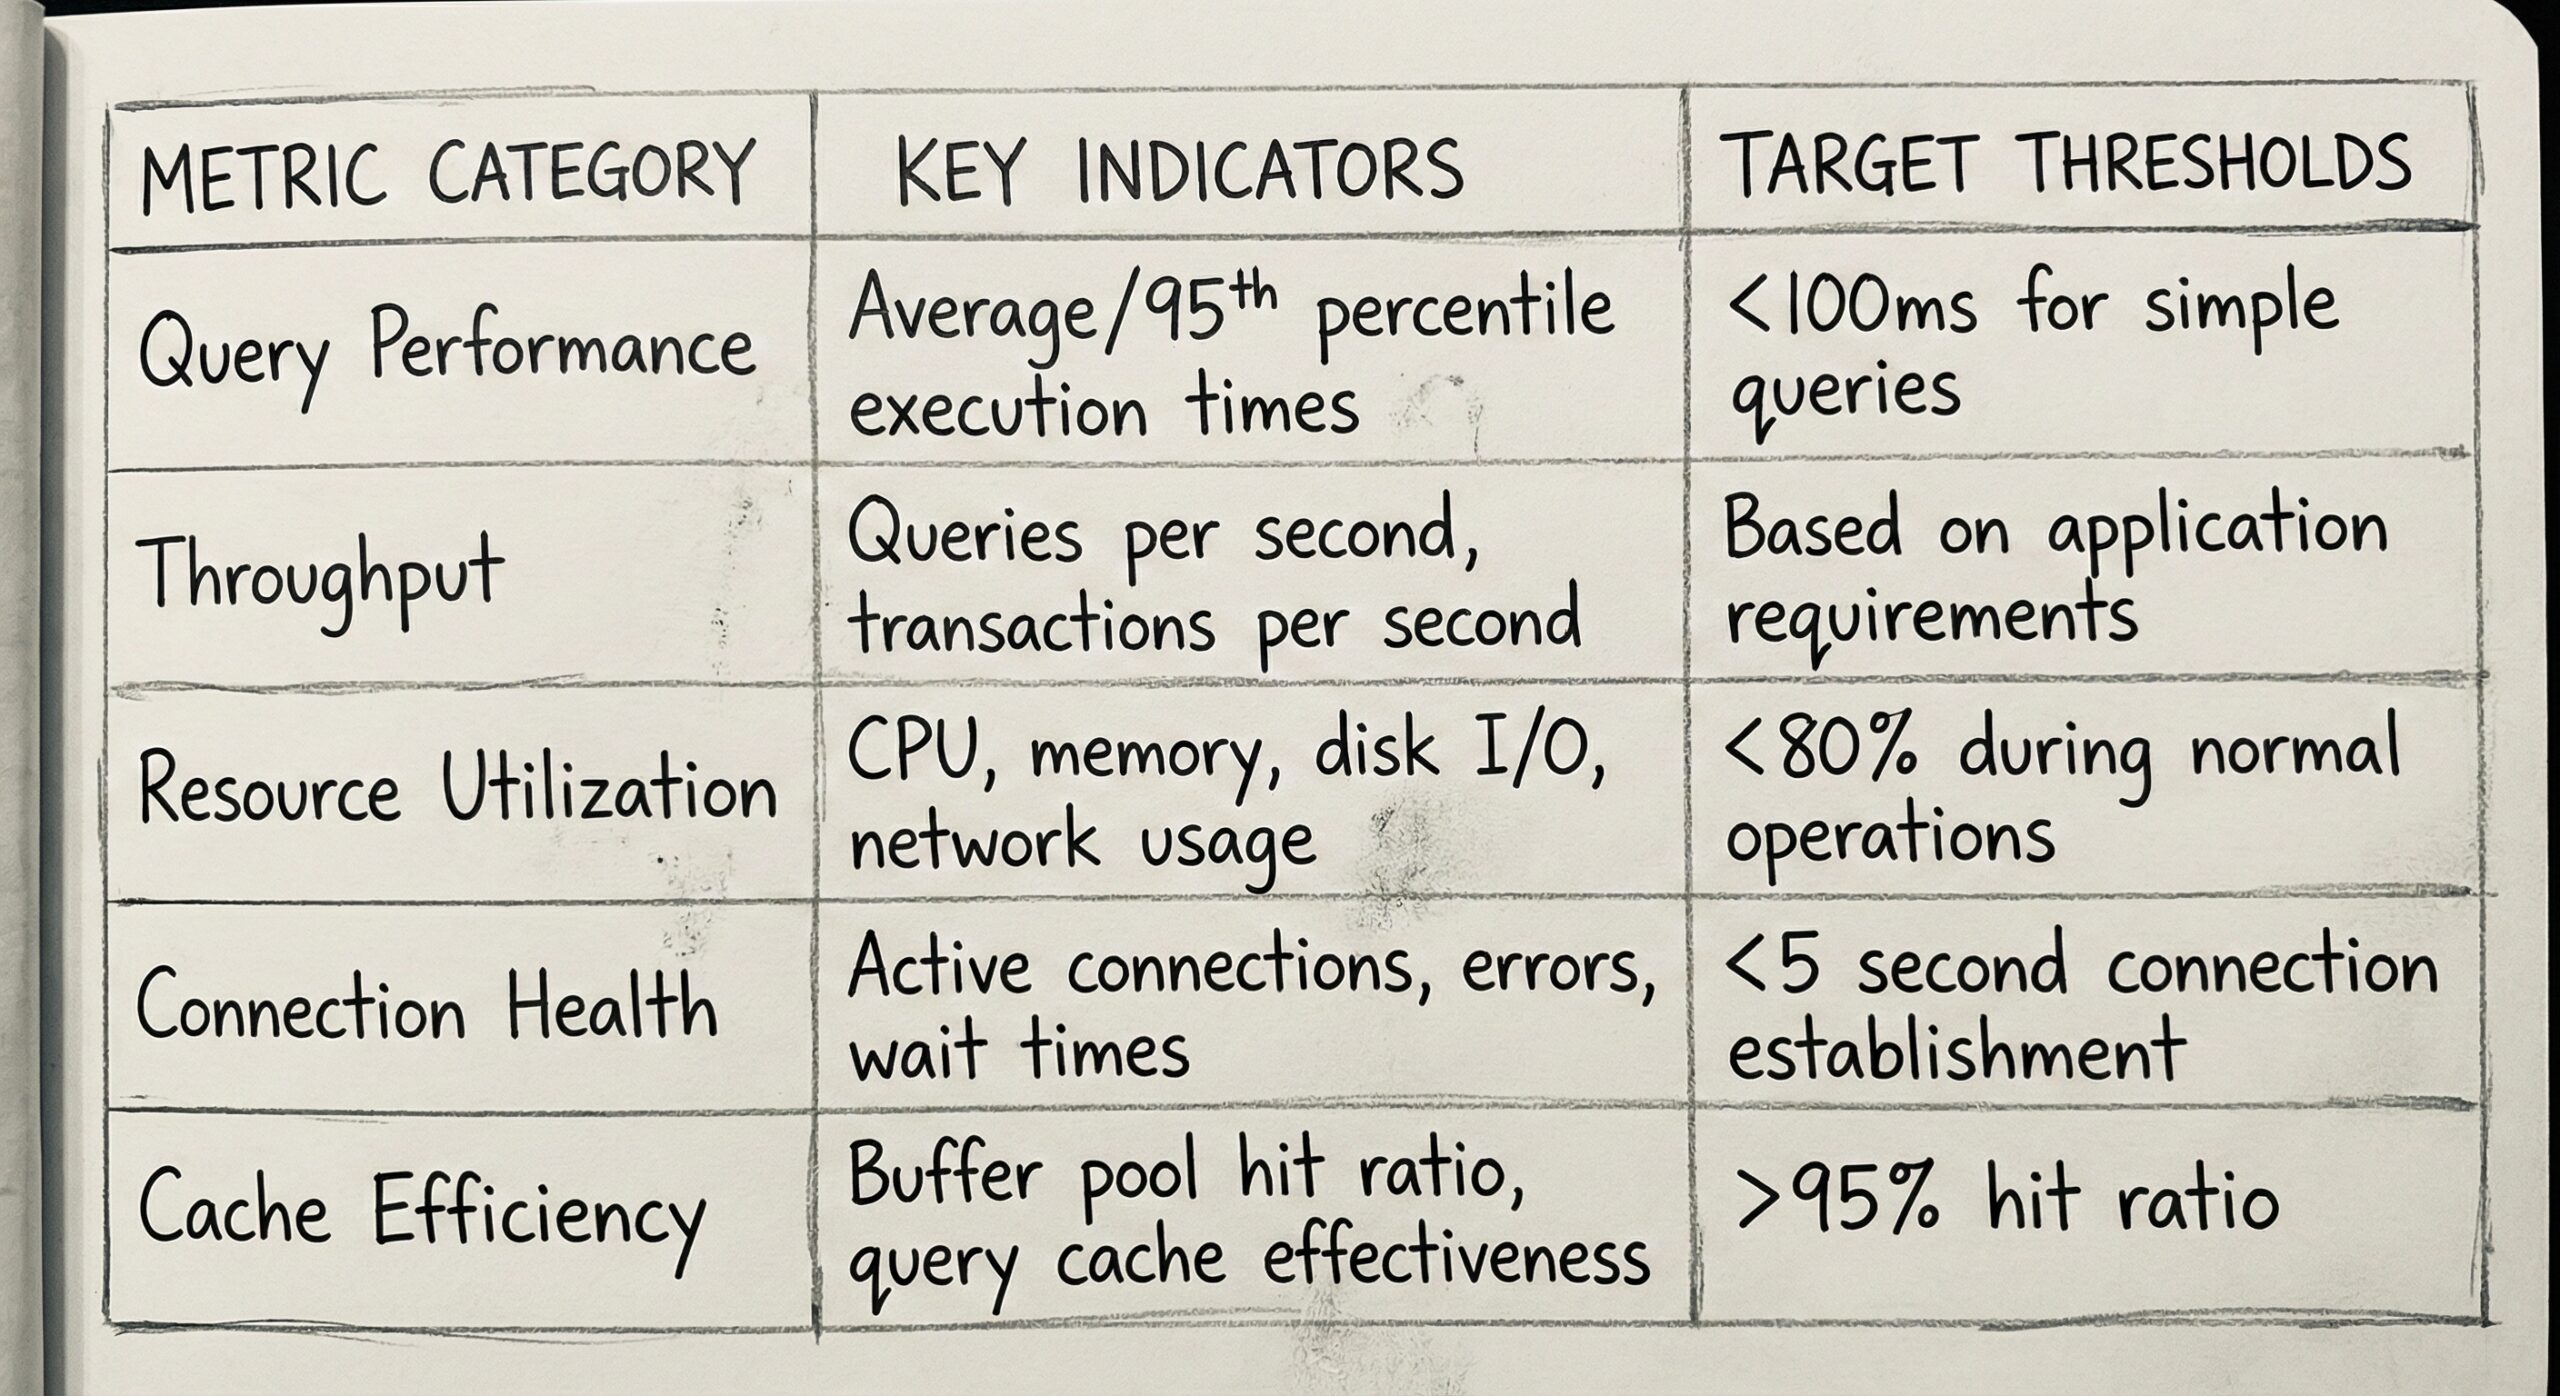
Recognize these performance indicators before they escalate into system-wide problems:
- Query execution times exceeding 100ms for simple operations
- CPU utilization consistently above 80% during normal operations
- Memory consumption approaching system limits
- Connection wait times exceeding 5 seconds
- Application response times degrading progressively
- Growing query queue lengths indicating processing bottlenecks
- Disk I/O wait times increasing during peak hours
Next-Generation Diagnostic Tools
MariaDB provides sophisticated built-in analysis capabilities enhanced in recent versions:
Performance Schema 2.0
The enhanced Performance Schema in MariaDB 12.1 offers granular insights into server operations, tracking query execution patterns, resource consumption metrics, and internal operation efficiency. Enable comprehensive monitoring to gain unprecedented visibility into performance bottlenecks.
AI-Enhanced Slow Query Analysis
Modern slow query logging integrates with AI-powered analysis tools that automatically identify optimization opportunities and suggest index improvements based on query patterns.
Advanced EXPLAIN Capabilities
The EXPLAIN statement now provides deeper insights into query execution plans, revealing optimization opportunities and index utilization patterns with enhanced detail for complex queries.
MariaDB Enterprise Platform 2026 Monitoring
The latest enterprise platform includes built-in performance monitoring with predictive analytics capabilities, enabling proactive optimization before issues impact users.
Server Configuration Optimization for 2026
Memory Configuration Mastery
Proper memory allocation remains the foundation of MariaDB performance optimization:
InnoDB Buffer Pool Optimization
innodb_buffer_pool_size = 70-80% of available RAM
innodb_buffer_pool_instances = CPU_cores / 4
This critical setting caches table data and indexes, dramatically reducing disk I/O operations. On dedicated database servers, allocate 70-80% of available RAM to the buffer pool.
Query Cache Evolution
Modern MariaDB versions handle caching differently than legacy systems. While query_cache_size was crucial historically, MariaDB 12.1’s improved internal caching mechanisms often perform better with query cache disabled under high concurrency workloads.
MyISAM Index Caching
For systems still utilizing MyISAM tables:
key_buffer_size = 25-30% of RAM
Connection Management Excellence
Dynamic Connection Scaling
max_connections = Based on concurrent user analysis
thread_cache_size = Typical concurrent connections
Monitor actual connection usage patterns rather than guessing optimal values. Too few connections cause user frustration; too many exhaust system resources.
InnoDB Performance Tuning
Transaction Log Optimization
innodb_log_file_size = 256MB to 2GB (based on write volume)
innodb_flush_log_at_trx_commit = 2 (balanced performance/safety)
Larger log files improve write performance but increase crash recovery time. Balance based on your specific write workload and recovery time requirements.
Advanced Query Optimization Strategies
AI-Powered Query Analysis
Leverage MariaDB’s integration with AI query optimization tools to automatically identify performance bottlenecks and receive intelligent optimization suggestions.
Query Performance Deep Dive
Execution Plan Analysis
EXPLAIN FORMAT=JSON SELECT * FROM users WHERE email = 'user@example.com';
Look for these optimization opportunities:
- Full table scans (type: ALL) indicating missing indexes
- High row examination counts suggesting inefficient filtering
- Temporary tables or filesorts adding unnecessary overhead
- Suboptimal join algorithms for complex queries
Modern Query Optimization Techniques
Selective Column Retrieval
-- Inefficient
SELECT * FROM large_table WHERE condition;

-- Optimized
SELECT id, name, email FROM large_table WHERE condition;
Smart Result Limiting
SELECT columns FROM table WHERE conditions
ORDER BY relevant_column
LIMIT 50 OFFSET 0;
Advanced JOIN Optimization
Ensure JOIN conditions utilize indexed columns and consider join order for multi-table queries:
-- Optimized join order
SELECT u.name, p.title
FROM users u
INNER JOIN posts p ON u.id = p.user_id
WHERE u.status = 'active'
AND p.published_date >= '2026-01-01';
Function Optimization
-- Inefficient (prevents index usage)
WHERE YEAR(created_date) = 2026

-- Efficient (index-friendly)
WHERE created_date >= '2026-01-01'
AND created_date < '2027-01-01'
Strategic Index Optimization
Intelligent Index Design
High-Cardinality Column Prioritization
Focus indexing efforts on columns with high selectivity (many unique values). Boolean flags and low-cardinality columns provide minimal performance benefits.
Composite Index Mastery
-- Optimized for multiple filter conditions
CREATE INDEX idx_user_activity ON users(status, last_login_date, account_type);
Index Column Ordering Strategy
- Equality conditions first
- Range conditions second
- Sort columns last
Index Maintenance Excellence
Performance Impact Assessment
Each index adds overhead to INSERT, UPDATE, and DELETE operations. Regularly audit index usage:
SELECT * FROM information_schema.INDEX_STATISTICS
WHERE TABLE_SCHEMA = 'your_database';
Redundancy Elimination
Remove redundant indexes consuming resources without providing benefits. If you have indexes on (a, b) and (a), the second is typically redundant.
Hardware and System-Level Optimization for 2026
Storage Technology Advancement
NVMe SSD Implementation
Modern NVMe SSDs provide exceptional performance improvements over traditional storage, particularly benefiting random read/write operations critical for database workloads.
Storage Architecture
- Separate InnoDB data files and transaction logs on different physical devices
- Implement RAID configurations appropriate for your performance/redundancy requirements
- Use modern file systems (XFS, ext4) with database-optimized mount options
Resource Allocation Strategy
Memory Requirements
Ensure sufficient RAM to cache working datasets in memory, minimizing expensive disk I/O operations. Modern applications require significantly more memory than legacy systems.
CPU Optimization
MariaDB benefits from multiple cores for concurrent query processing. Monitor CPU utilization patterns to identify bottlenecks and scale appropriately.
Continuous Monitoring and Optimization
Essential Performance Metrics
Establish comprehensive baseline metrics and monitor trends:
Proactive Maintenance Protocols
Statistical Updates
ANALYZE TABLE table_name;
Regular table analysis ensures the query optimizer makes informed decisions based on current data distribution.
Storage Optimization
OPTIMIZE TABLE table_name;
Periodic table optimization reclaims unused space and reduces fragmentation.
Troubleshooting Common Performance Scenarios
High CPU Usage Resolution
- Identify resource-intensive queries using Performance Schema
- Check for missing indexes causing full table scans
- Review concurrent query execution patterns
- Implement application-layer result caching
- Consider query result materialization for complex reports
Memory Exhaustion Management
- Audit buffer pool allocation against actual requirements
- Investigate memory leaks in stored procedures or triggers
- Implement connection limits preventing memory overconsumption
- Review sort and join buffer configurations
Write Performance Optimization
- Increase innodb_log_file_size for write-intensive workloads
- Adjust durability settings for acceptable performance/safety balance
- Implement batch operations instead of individual inserts
- Evaluate index overhead on frequently updated tables
Connection Bottleneck Resolution
- Analyze legitimate connection demand before increasing limits
- Implement connection pooling at the application layer
- Audit application code for connection leaks
- Optimize thread cache settings to reduce connection overhead
Best Practices for Sustained Performance Excellence
Performance Management Framework
- Baseline Documentation: Establish comprehensive performance baselines for quick deviation identification
- Testing Protocols: Apply all configuration changes in non-production environments first
- Continuous Monitoring: Implement automated monitoring with intelligent alerting for performance degradation
- Scheduled Maintenance: Regular optimization and maintenance windows
- Capacity Planning: Proactive resource scaling based on growth projections
- Change Documentation: Maintain detailed records of modifications and their impacts
- Version Management: Keep MariaDB updated to benefit from performance improvements and security fixes2
MariaDB 2026 Advanced Features
Leverage the latest MariaDB Enterprise Platform 2026 capabilities4:
- AI-Enhanced RAG Integration: Built-in retrieval-augmented generation for intelligent query optimization
- Advanced Security Features: Database firewall with performance monitoring
- Seamless Compatibility: Enhanced Oracle and MySQL compatibility reducing migration overhead
Conclusion
MariaDB performance troubleshooting in 2026 requires a sophisticated, multi-layered approach combining intelligent configuration management, advanced query optimization, strategic indexing, and proactive monitoring. By implementing these systematic optimization strategies, organizations can achieve up to 300% query speed improvements and 50-80% resource reduction, transforming database performance from a bottleneck into a competitive advantage.
Start with high-impact optimizations—proper indexing and memory configuration—then progressively refine other aspects based on your specific workload characteristics. With MariaDB’s superior performance compared to MySQL and the advanced capabilities of MariaDB Enterprise Platform 2026, organizations have unprecedented opportunities to achieve exceptional database performance.
Ready to optimize your MariaDB performance? Begin with a comprehensive performance audit using the diagnostic tools outlined in this guide, then systematically implement the optimization strategies most relevant to your workload patterns.
Related Topics: MySQL vs MariaDB Performance Comparison, Database Query Optimization Techniques, InnoDB Configuration Best Practices, SQL Performance Tuning Guide, Database Monitoring Tools 2026
Further Reading
- Enterprise Database Systems Software Support
- Data Architecture and Engineering
- Data Analytics
- MariaDB Consulting
- MariaDB Support
- Remote DBA Services