postgresql wait events analysis in PostgreSQL appears straightforward at first but becomes challenging in real production systems. This guide presents the field-tested approach, built from production PostgreSQL deployments at petabyte scale.
Quick answer
Postgresql wait events analysis in PostgreSQL is a measurement problem first and a tuning problem second. Pull a 30-minute baseline from pg_stat_statements and pg_wait_sampling, locate the responsible subsystem, change one variable at a time, and verify against the baseline before you ship the next tweak. The diagnostic queries are below.
What is postgresql wait events?
Postgresql wait events describes how PostgreSQL handles Postgresql wait events across the layers where things actually break. It is fundamentally about database monitoring and PostgreSQL observability, with performance monitoring setting the upper bound on what's possible. This matters because most production PostgreSQL incidents trace back to one of these three.
On the inside, postgresql wait events involves a small set of PostgreSQL subsystems: the buffer manager, the write-ahead log, the planner and statistics collector, autovacuum, and the replication and HA layers. This guide walks through each in the order you should investigate them when a real production problem hits, with the SQL we actually run during metrics collection engagements.
Why PostgreSQL wait events analysis matters in production
Why does postgresql wait events matter? Because the cost of getting it wrong shows up on three timelines at once: an immediate p99 spike, a quarterly cost overrun, and an annual SLA miss. Teams that handle this well treat it as a continuous practice, not a one-time fix.
In production PostgreSQL deployments, the scenarios where postgresql wait events bites are surprisingly consistent. A sudden traffic shape change. A seemingly innocuous schema change that triggers replanning. A storage tier change on the cloud provider's side that nobody told the database team about. The diagnostics in this guide work for all three.
A useful mental model: every PostgreSQL change has a cost, a blast radius, and a reversibility. The cheapest, smallest, most reversible change that actually moves your metric is almost always the right first step. It may not be the change you eventually want in steady state, but it buys you the time and confidence to make the bigger one safely.
How postgresql wait events works in PostgreSQL
PostgreSQL behavior around postgresql wait events is governed by five subsystems. Each can quietly affect throughput in ways that aren't visible from query logs alone.
- Buffer manager. The shared_buffers pool decides what stays hot in PostgreSQL memory versus the OS page cache.
- Write-ahead log. Every change is written to WAL before it touches the heap. Replication, PITR, and crash recovery all depend on it.
- Planner and statistics. The cost-based optimizer interacts with statistics gathered by ANALYZE to choose query plans.
- Autovacuum. Background workers reclaim dead tuples produced by MVCC. Mistuned autovacuum is the single most common cause of Prometheus PostgreSQL regressions.
- Process model. PostgreSQL forks a backend per connection. work_mem is allocated per-backend, which is exactly the surprise that takes down clusters during connection storms.
Knowing which layer your symptom belongs to determines the fix. A p99 spike caused by checkpoint I/O is configuration. A regression caused by stale planner statistics is operational. A correlation between table growth and write latency is almost always autovacuum starvation. The diagnostic queries below help you place the symptom on this map before you change anything.
How to diagnose postgresql wait events issues
Start with measurement. The temptation is to jump straight to ALTER SYSTEM and start turning knobs, but every senior PostgreSQL DBA learns the same lesson the hard way: the first change you make is almost always the wrong one if you haven't measured first.
Step 1. Top metrics to alert on: connection saturation, lag, long-running transactions.
SELECT count(*) FILTER (WHERE state='active') AS active,
 count(*) AS total,
 (SELECT setting::int FROM pg_settings WHERE name='max_connections') AS cap
FROM pg_stat_activity;

SELECT extract(epoch FROM now() - pg_last_xact_replay_timestamp()) AS lag_s;

SELECT pid, now() - xact_start AS xact_age, query
FROM pg_stat_activity
WHERE xact_start IS NOT NULL
ORDER BY xact_age DESC LIMIT 10;
Read the output with two questions in mind. Does the shape match what you expected? And what's the worst-case row? The shape tells you whether your mental model of the cluster matches reality. The worst-case row tells you where the next surprise will come from in your wait event analysis workflow.
How to fix postgresql wait events step by step
A real fix is more than the SQL statement. It's the change, the rollout, and the proof. The structure below separates them deliberately so you don't accidentally collapse them into a single Slack message that loses the rollback path.
On managed PostgreSQL services like AWS RDS, Aurora, Cloud SQL, and Azure Flexible Server, schema changes still happen via plain SQL. Configuration changes happen through parameter group rebuilds. Some parameters take effect immediately, others require a reboot. Verify with SELECT name, context FROM pg_settings WHERE name = '<param>'; before scheduling the change window.
Step 2. Datadog Agent config for PostgreSQL with custom queries.
init_config:

instances:
 - host: prod-pg.example.local
 port: 5432
 username: Datadog
 password: "<from-vault>"
 dbname: appdb
 collect_database_size_metrics: true
 relations:
 - relation_regex:.*
 custom_queries:
 - metric_prefix: postgresql.repl
 query: |
 SELECT extract(epoch FROM now() - pg_last_xact_replay_timestamp())
 columns:
 - name: lag_seconds
 type: gauge
Step 3. Run postgres_exporter via Docker with a custom queries file.
docker run -d --name postgres_exporter \
 -e DATA_SOURCE_NAME="postgresql://exporter:pass@prod-pg:5432/postgres?sslmode=require" \
 -v $(pwd)/queries.yaml:/queries.yaml \
 -p 9187:9187 \
 quay.io/prometheuscommunity/postgres-exporter \
 --extend.query-path=/queries.yaml
Step 4. Validation. Re-run your baseline query and compare the results. If the change didn't move the metric you set out to improve, revert before chasing a second hypothesis. Tuning one PostgreSQL parameter at a time is the only way to keep your sanity, and your audit trail, intact.
Production guardrails and monitoring
Guardrails are how a fix becomes durable. Without them, PostgreSQL changes drift over time as configurations diverge across environments and someone reverts a setting during a hurried incident response.
- Add a Datadog or Prometheus alert on the metric you just improved at a threshold 20 percent above your new baseline.
- Capture an EXPLAIN (ANALYZE, BUFFERS) for any regressed query into your runbook so the on-call engineer has the next-step diagnostic ready.
- Document the rollback path: the exact SQL or ALTER SYSTEM sequence to restore the prior state if the change misbehaves.
- Set a calendar reminder to re-validate after the next major PostgreSQL version upgrade. Planner behaviors and default GUC values do change.
- Record the pg_stat_statements query ID and a representative plan in your team wiki so you can compare against future regressions in log analysis.
- Schedule a follow-up review 30 days after the change to confirm the improvement persisted under realistic production traffic.
Going deeper with cross-checks
Once the basic fix is in place, the next layer of validation cross-checks against complementary signals. The query below is the one we run on production PostgreSQL deployments to confirm the change has propagated everywhere it should.
Generate a pgBadger HTML report from log files.
pgBadger -j 8 -O /var/www/pgbadger \
 --prefix '%t [%p]: [%l-1] user=%u,db=%d,app=%a,client=%h ' \
 /var/log/postgresql/postgresql-2026-04-*.log
Common mistakes and anti-patterns
If you only read one section of this post, make it this one. These are the missteps we watch teams repeat across hundreds of PostgreSQL engagements. Avoid them and you've already done better than half the industry.
- Tuning postgresql wait events by copy-pasting from a 2014 blog post without re-validating against PostgreSQL 14, 15, 16, or 17 behavior.
- Changing more than one PostgreSQL parameter at a time without measurement.
- Forgetting to ANALYZE after a large data load, then wondering why the planner picked a sequential scan over your shiny new index.
- Trusting an unverified backup or untested failover for PostgreSQL telemetry.
- Treating autovacuum as something to disable rather than something to tune.
- Allowing developers to write production queries with no EXPLAIN review.
PostgreSQL on AWS, Aurora, GCP, Azure
Managed PostgreSQL changes the operational surface area, not the underlying engine. Schema changes still happen via plain SQL. Configuration changes happen through parameter groups. The biggest exception is Aurora, where decoupled storage means a few of the standard tuning rules need to be reframed.
Specifics worth memorizing. AWS RDS PostgreSQL on gp3 storage gives you provisioned IOPS, but the maximum is per-volume, not per-instance. That fact surprises customers scaling vCPU and expecting linear I/O. Google AlloyDB's columnar engine is opt-in per table; turning it on is a one-line SQL call, but the analytical workload eligibility rules aren't always obvious until you read the EXPLAIN plan. Azure Database for PostgreSQL Flexible Server exposes a broader set of extensions than RDS or Aurora, including pg_partman, pgvector, TimescaleDB, and Citus on the Citus-flavored variant.
When this approach is the wrong starting point
This technique assumes a roughly normal OLTP PostgreSQL workload with healthy autovacuum. It's the wrong starting point if your workload is dominated by long analytical queries against a Citus or TimescaleDB hypertable, if you run on Aurora's storage-decoupled architecture (where buffer-pool semantics differ), or if the symptom is actually a network or kernel-level issue masquerading as a PostgreSQL problem.
Another pattern we see often. An APAC e-commerce client cut their on-call burden 70 percent after we replaced 40 metric-based alerts with six SLO-based alerts. The team finally trusted their pager again, and the unproductive 02:00 wakeups stopped.
Frequently asked questions
What are the top PostgreSQL metrics to alert on?
Replication lag, connection saturation, transaction-id age, autovacuum staleness, p99 query latency, and disk space free. Everything else belongs on dashboards but not on your pager.
Should Production teams use Datadog or pganalyze for PostgreSQL monitoring?
Datadog fits teams that already standardize on it for application observability. pganalyze fits teams where PostgreSQL is the most important system you operate. Its query-level analysis is unmatched in the market.
Is pg_stat_statements safe to leave enabled in production?
Yes. pg_stat_statements is the single most useful PostgreSQL extension for performance work. Overhead is well under 1 percent on every workload we have measured. Enable it on every PostgreSQL deployment.
How often should I rotate PostgreSQL logs?
Daily, with at least 14 days of online retention, and longer cold storage if you ship logs to a SIEM. Use log_rotation_age = 1d plus a logrotate or vector pipeline to ship to your log analysis platform.
What is PostgreSQL wait event analysis?
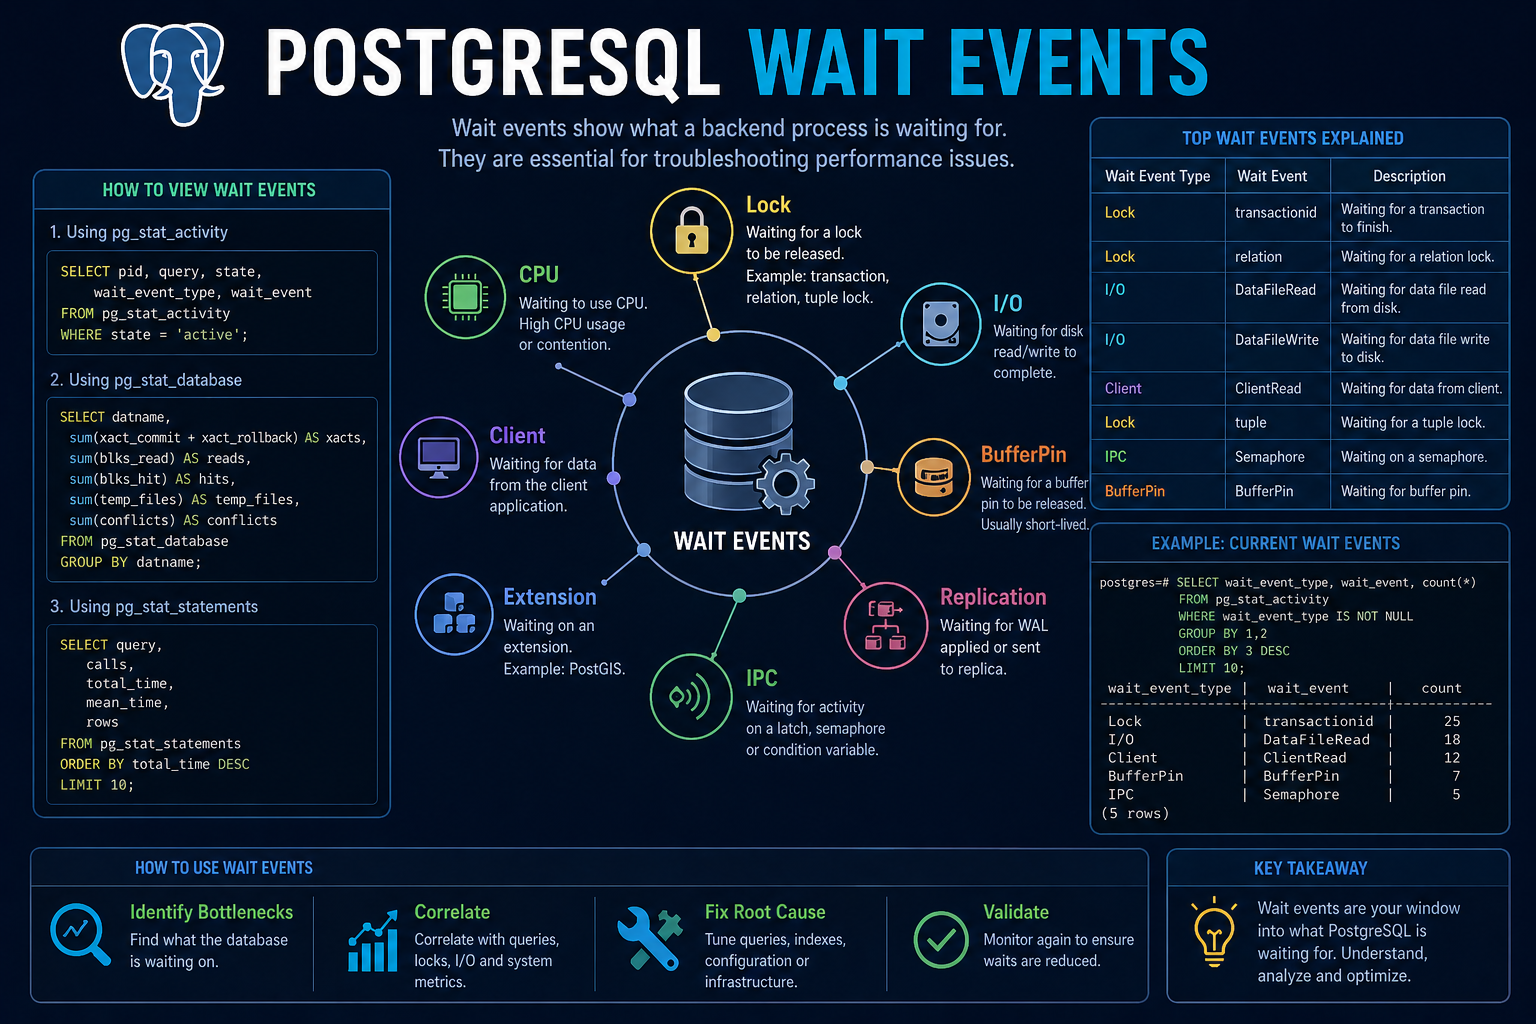
PostgreSQL records what each backend is waiting on: locks, I/O, IPC. Sampling pg_stat_activity.wait_event at one-second intervals tells you where contention lives, often more clearly than queries alone.
Where should I start if I’m new to wait event analysis in postgresql?
Read this guide end to end, then run the diagnostic SQL queries against a non-production PostgreSQL database to build intuition. Most engineers we coach are productive within a day. Bookmark this page, then move on to the cluster posts linked below for deeper dives.
Further reading
Mastering PostgreSQL Wait Events: Performance Impact and Troubleshooting Techniques
Optimizing PostgreSQL: A Guide to Troubleshooting Long-Running Queries and Wait Events
How to Identify and Tune PostgreSQL Performance Issues using Wait Events?