Troubleshooting Redis Performance Using eBPF: A Comprehensive Guide by MinervaDB
Redis, an in-memory key-value store, powers high-throughput, low-latency applications across industries. However, performance issues like memory exhaustion, CPU spikes, and latency degradation can severely impact application reliability. Traditional monitoring tools often lack the granularity needed to pinpoint root causes, especially in complex, containerized environments like Kubernetes.
Enter eBPF (extended Berkeley Packet Filter). This revolutionary Linux kernel technology enables deep, real-time observability without requiring code changes or agent instrumentation. At MinervaDB, we leverage eBPF’s power to deliver advanced troubleshooting capabilities for critical open-source databases, including Redis.
This guide explores how eBPF transforms Redis performance monitoring, providing actionable insights for database administrators and DevOps engineers.
The Challenges of Traditional Redis Monitoring
Monitoring Redis isn’t always straightforward. Common challenges include:
- Limited Visibility: Basic tools like INFO commands or Redis exporters provide aggregate metrics but miss per-operation latency and system-level context.
- Performance Overhead: Enabling the MONITOR command for debugging floods logs and degrades performance, making it unsuitable for production.
- Context Gaps: Correlating Redis behavior with application code, network calls, or system resources is difficult with siloed monitoring.
- Kubernetes Complexity: In dynamic container environments, tracking ephemeral Redis instances and network flows adds significant complexity.
These limitations lead to prolonged troubleshooting cycles and reactive problem-solving.
What is eBPF and Why It Matters for Redis
eBPF is a secure, efficient technology that allows custom programs to run inside the Linux kernel. Think of it as a “superpower” for system observability, networking, and security.
Unlike traditional tools, eBPF can:
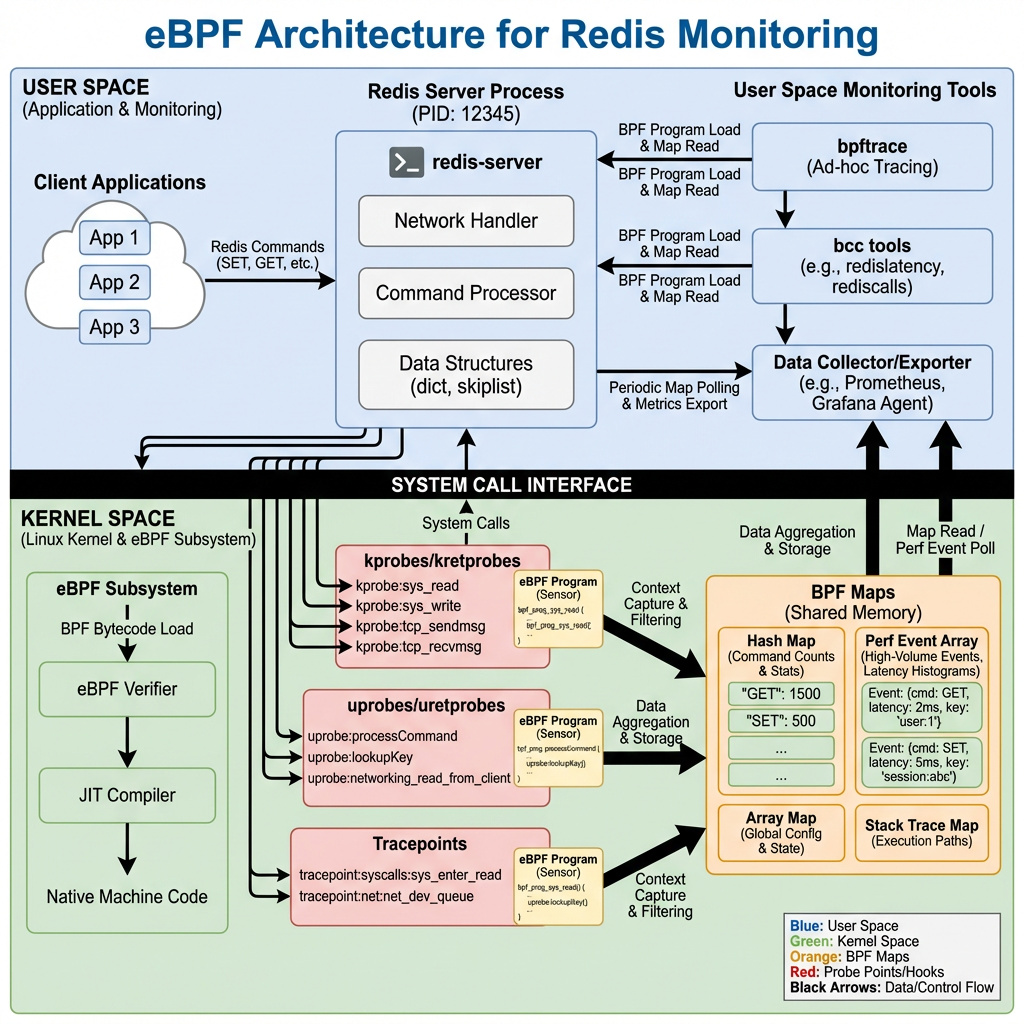
- Attach to kernel functions, system calls, or user-space applications (using uprobes) to capture low-level events.
- Collect data with minimal overhead, often less than 1-3%.
- Provide end-to-end tracing, linking database queries to HTTP requests and network packets.
For Redis, this means you can observe every GET, SET, or HGETALL operation at the kernel level, measuring exact latency and identifying bottlenecks without modifying your Redis server or application code.
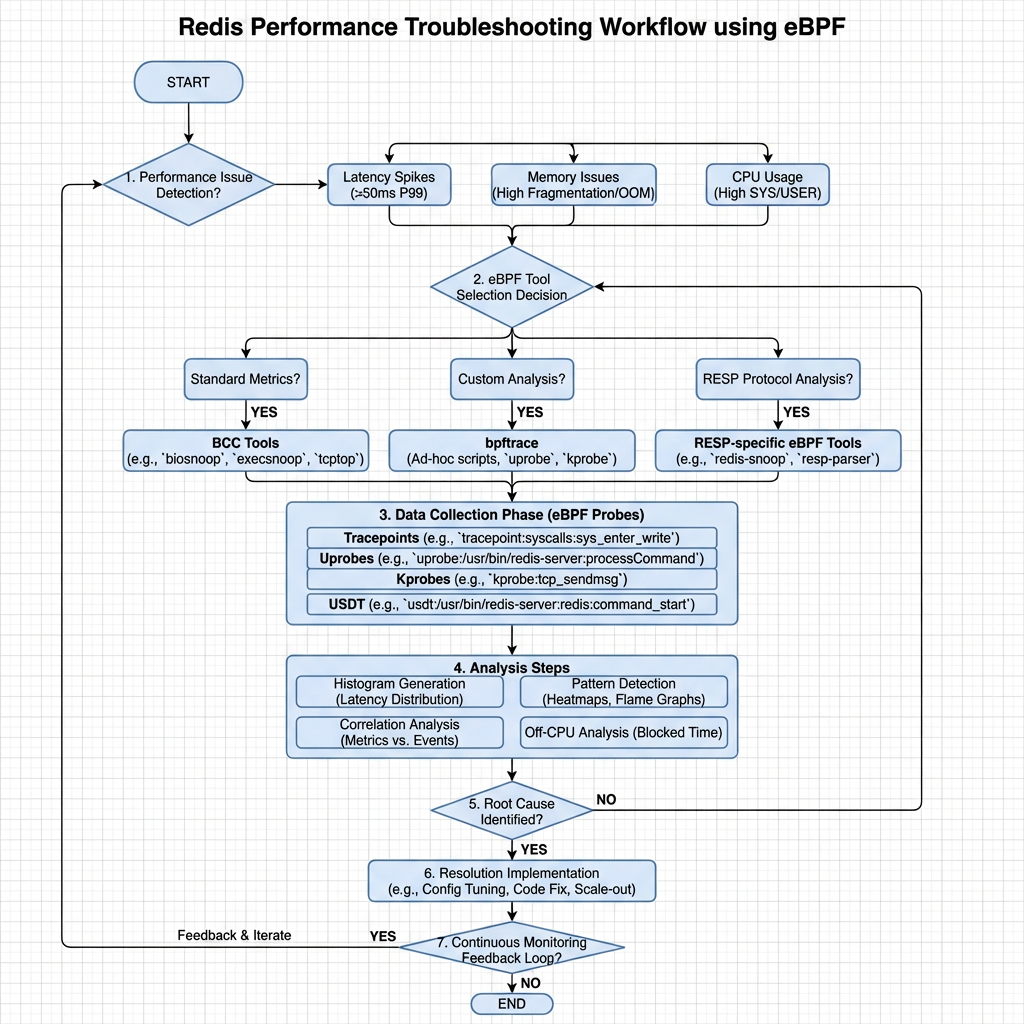
How eBPF Enables Deep Redis Observability
1. Real-Time Traffic Monitoring
eBPF can intercept network packets and system calls related to Redis. This allows tools to:
- Capture every Redis command and its response.
- Measure round-trip time (RTT) and server processing latency.
- Detect anomalous patterns, such as sudden spikes in KEYS * commands that can block the Redis event loop.
2. Kernel-Level Performance Profiling
By profiling CPU usage at the function level, eBPF helps identify if Redis is CPU-bound due to:
- Heavy Lua script execution.
- Large key serialization/deserialization.
- Background tasks like AOF rewriting or RDB snapshots.
This granular insight is invaluable for optimization.
3. Memory and I/O Contention Analysis
eBPF can trace memory allocation events and disk I/O, helping you correlate Redis performance with system resource contention. For example, if Redis BGSAVE operations coincide with I/O waits on other processes, you can pinpoint storage bottlenecks.
4. Seamless Kubernetes Integration
In Kubernetes, eBPF-based tools like Cilium or Pixie provide automatic service discovery and topology mapping. They can:
- Auto-detect Redis pods and start monitoring.
- Visualize network flows between applications and Redis.
- Trace requests across microservices, showing how Redis latency impacts end-user response times.
MinervaDB’s Approach to eBPF-Powered Redis Troubleshooting
MinervaDB specializes in advanced database performance engineering across PostgreSQL, MySQL, MongoDB, and Redis.
While our public repositories showcase eBPF tooling for MongoDB, the same principles apply to Redis. Our methodology includes:
Diagnostic Data Collection During Incidents
We deploy lightweight eBPF probes during performance incidents to capture:
- High-frequency latency histograms for Redis commands.
- Stack traces of slow operations.
- System call patterns (e.g., read(), write(), epoll_wait()).
This data is collected with zero instrumentation, preserving system stability.
Automatic Query and Index Analysis
Although Redis doesn’t use traditional indexes like SQL databases, eBPF can still identify inefficient data access patterns, such as:
- Frequent scans of large hash maps.
- Repeated SMEMBERS calls on big sets.
- Pipeline inefficiencies.
We analyze these patterns to recommend data structure optimizations or caching strategies.
Integration with APM and Observability Platforms
Our eBPF data integrates with APM tools to provide a unified view of application performance. For example, we can show how a slow Redis ZADD operation contributes to a 500ms delay in an API endpoint.
Hands-On: Setting Up eBPF for Redis Monitoring
While MinervaDB offers enterprise-grade support, you can experiment with open-source eBPF tools.
Option 1: Using Open-Source eBPF Agents
Tools like the Alaz eBPF agent or groundcover’s sensor offer Redis monitoring out of the box.
# Example: Deploying an eBPF-based observability agent
helm repo add groundcover https://helm.groundcover.com
helm install my-redis-monitor groundcover/groundcover
These agents auto-detect Redis instances and begin collecting metrics.
Option 2: Building Custom eBPF Probes
For advanced users, you can write custom eBPF programs using the bcc toolkit.
# Example: Tracing Redis network I/O with bcc
from bcc import BPF

# Load eBPF program
bpf_code = """
#include <uapi/linux/ptrace.h>
#include <net/sock.h>

BPF_HASH(start, u64, u64);

int trace_tcp_send(struct pt_regs *ctx, struct sock *sk) {
    u64 pid = bpf_get_current_pid_tgid();
    u64 ts = bpf_ktime_get_ns();
    start.update(&pid, &ts);
    return 0;
}
"""

b = BPF(text=bpf_code)
b.attach_kprobe(event="tcp_v4_connect", fn_name="trace_tcp_send")

print("Tracing Redis network activity...")
try:
    b.trace_print()
except KeyboardInterrupt:
    exit()
This script traces TCP connections, which can be filtered for Redis ports (6379).
Option 3: Community Projects
Explore projects like dorkamotorka/redis-ebpf on GitHub, which provides a foundation for Redis observability using Go and eBPF.
Best Practices for eBPF-Based Redis Monitoring
- Start with High-Level Metrics: Use eBPF to capture command rates, latencies, and error rates before diving into low-level tracing.
- Focus on Latency Breakdowns: Measure time spent in network, kernel, and Redis processing to isolate bottlenecks.
- Correlate with Application Metrics: Link Redis performance to user-facing KPIs like API response time.
- Secure Your eBPF Programs: Only trusted users should deploy eBPF code, as it runs in kernel space.
- Use in Production with Caution: While eBPF is low-overhead, monitor its impact during initial deployment.
The Future of Redis Observability
The future lies in autonomous, context-aware monitoring. eBPF is a key enabler, allowing platforms to:
- Automatically detect and alert on anti-patterns.
- Suggest configuration optimizations (e.g., maxmemory settings).
- Predict capacity issues before they occur.
MinervaDB is at the forefront of this evolution, applying eBPF not just for troubleshooting, but for proactive performance engineering.
Conclusion
Troubleshooting Redis performance in modern environments demands more than basic monitoring. eBPF provides the deep, real-time visibility needed to diagnose issues at their root cause—whether in the kernel, network, or application layer.
By adopting eBPF-powered tools, organizations can move from reactive firefighting to proactive performance optimization. While open-source options exist, enterprise-grade support from experts like MinervaDB ensures reliability, security, and maximum ROI.
Embrace eBPF today and unlock the full potential of your Redis deployments.
Further Reading:
- Redis Support
- NoSQL Support
- Cloud Native Data Operations Support
- Data Analytics and Data Engineering
- ClickHouse
- ChistaDATA University