Tuning CockroachDB Thread Operations for Optimal Performance
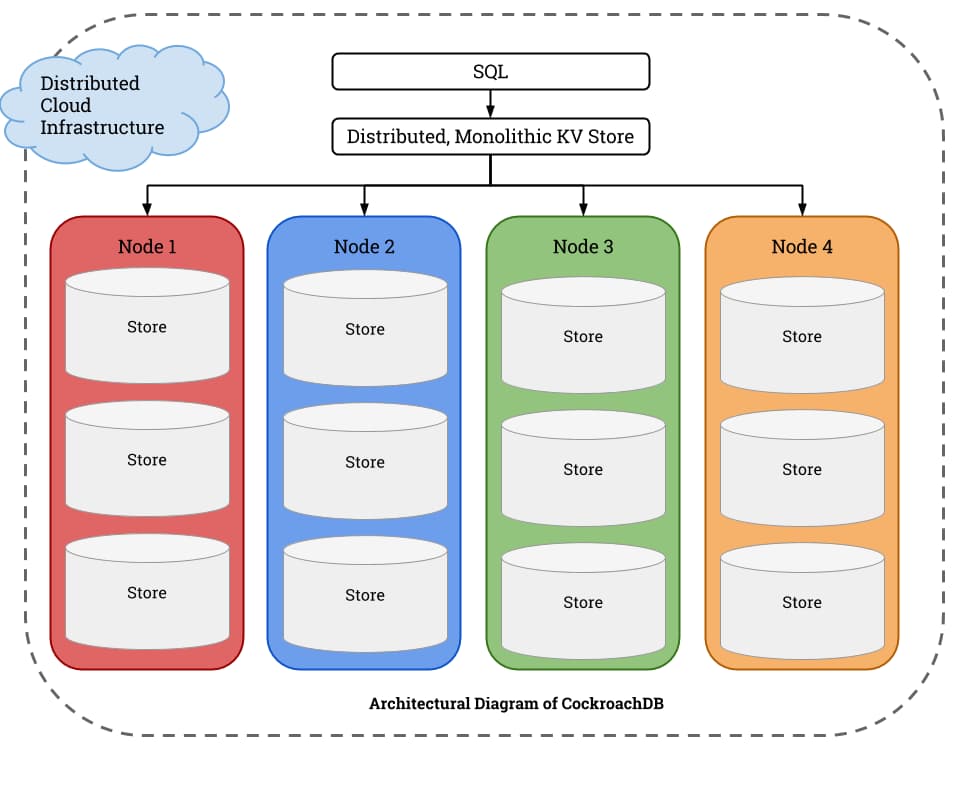
CockroachDB is a distributed SQL database that leverages Go’s lightweight concurrency model through goroutines to achieve high-scale performance across multiple nodes [1][4]. Understanding and optimizing thread operations is critical for maximizing cluster throughput, minimizing latency, and ensuring stable performance under varying workloads. This comprehensive guide examines the key parameters, monitoring strategies, and best practices for tuning CockroachDB thread operations to achieve optimal performance.
Understanding CockroachDB’s Threading Model
CockroachDB is written in Go and utilizes goroutines as its primary concurrency primitive rather than traditional operating system threads [9]. The Go runtime manages these goroutines efficiently across available CPU cores, with the GOMAXPROCS setting controlling the maximum number of OS threads that can execute Go code simultaneously [23][25]. This design enables CockroachDB to handle thousands of concurrent operations while maintaining low overhead compared to thread-per-connection models used by traditional databases.
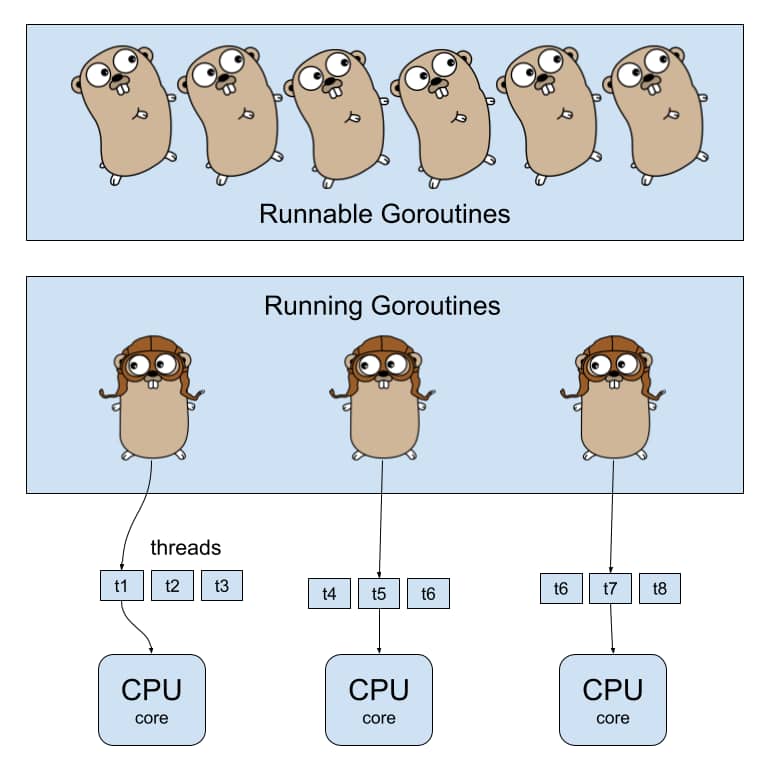
The database employs a sophisticated admission control system that monitors goroutine scheduling to prevent CPU overload [9]. When the number of runnable goroutines exceeds 32 per CPU core, the admission control system activates to prioritize critical operations and queue lower-priority work [9][19]. This threshold-based approach ensures cluster stability during high-load scenarios while maintaining consistent performance for essential database operations.
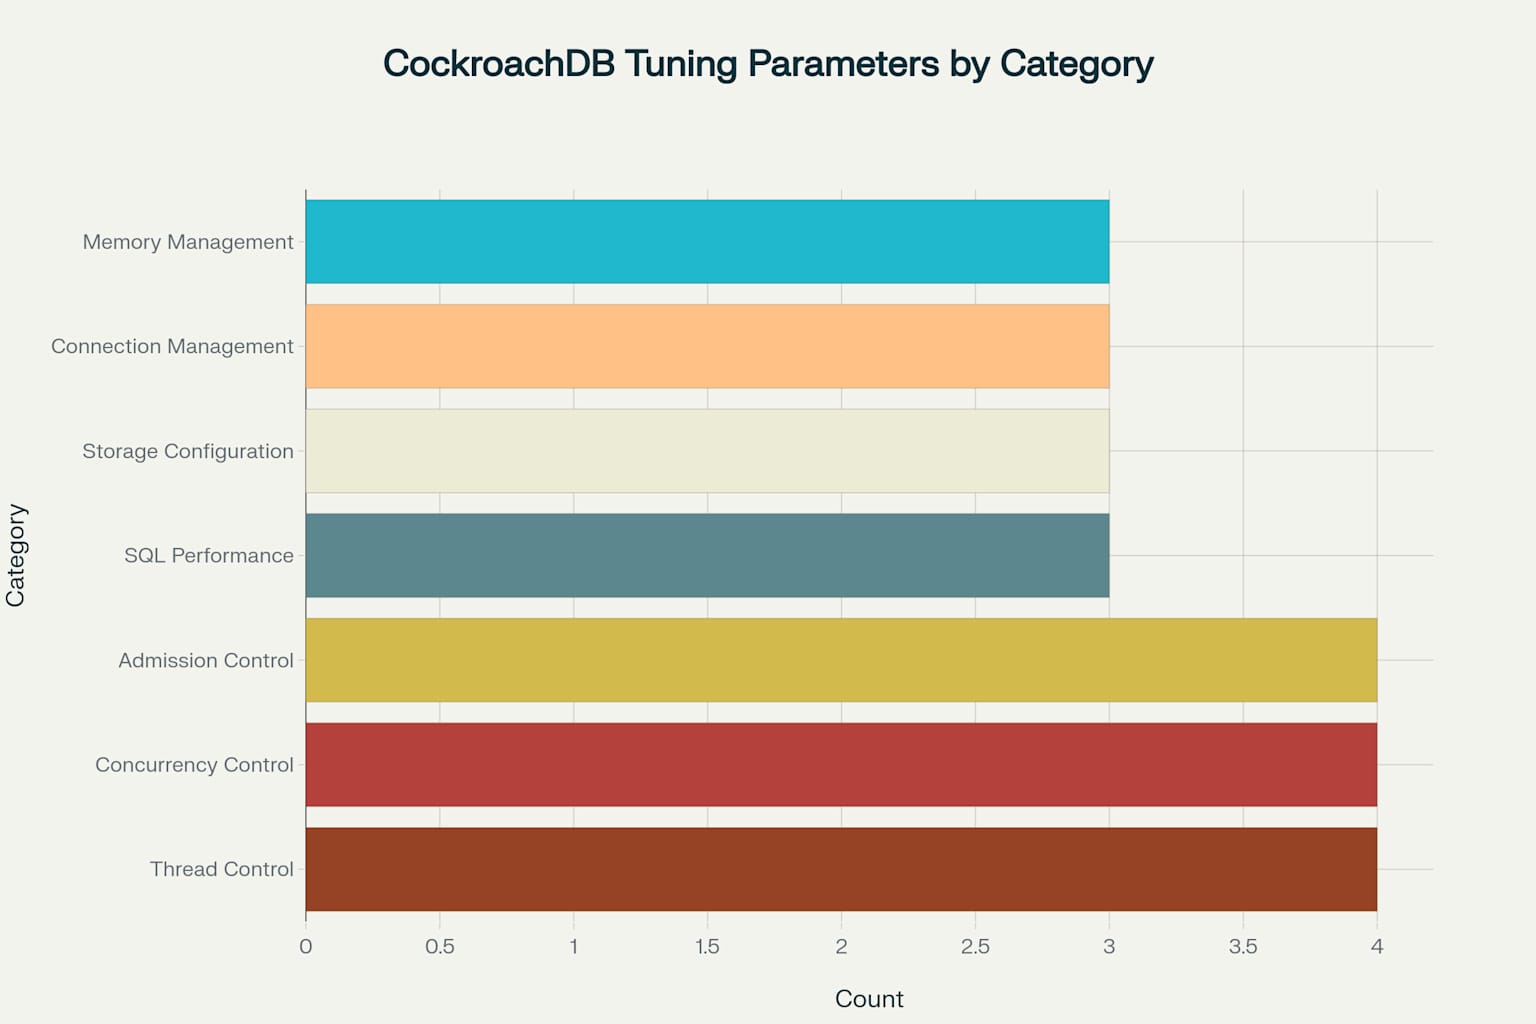
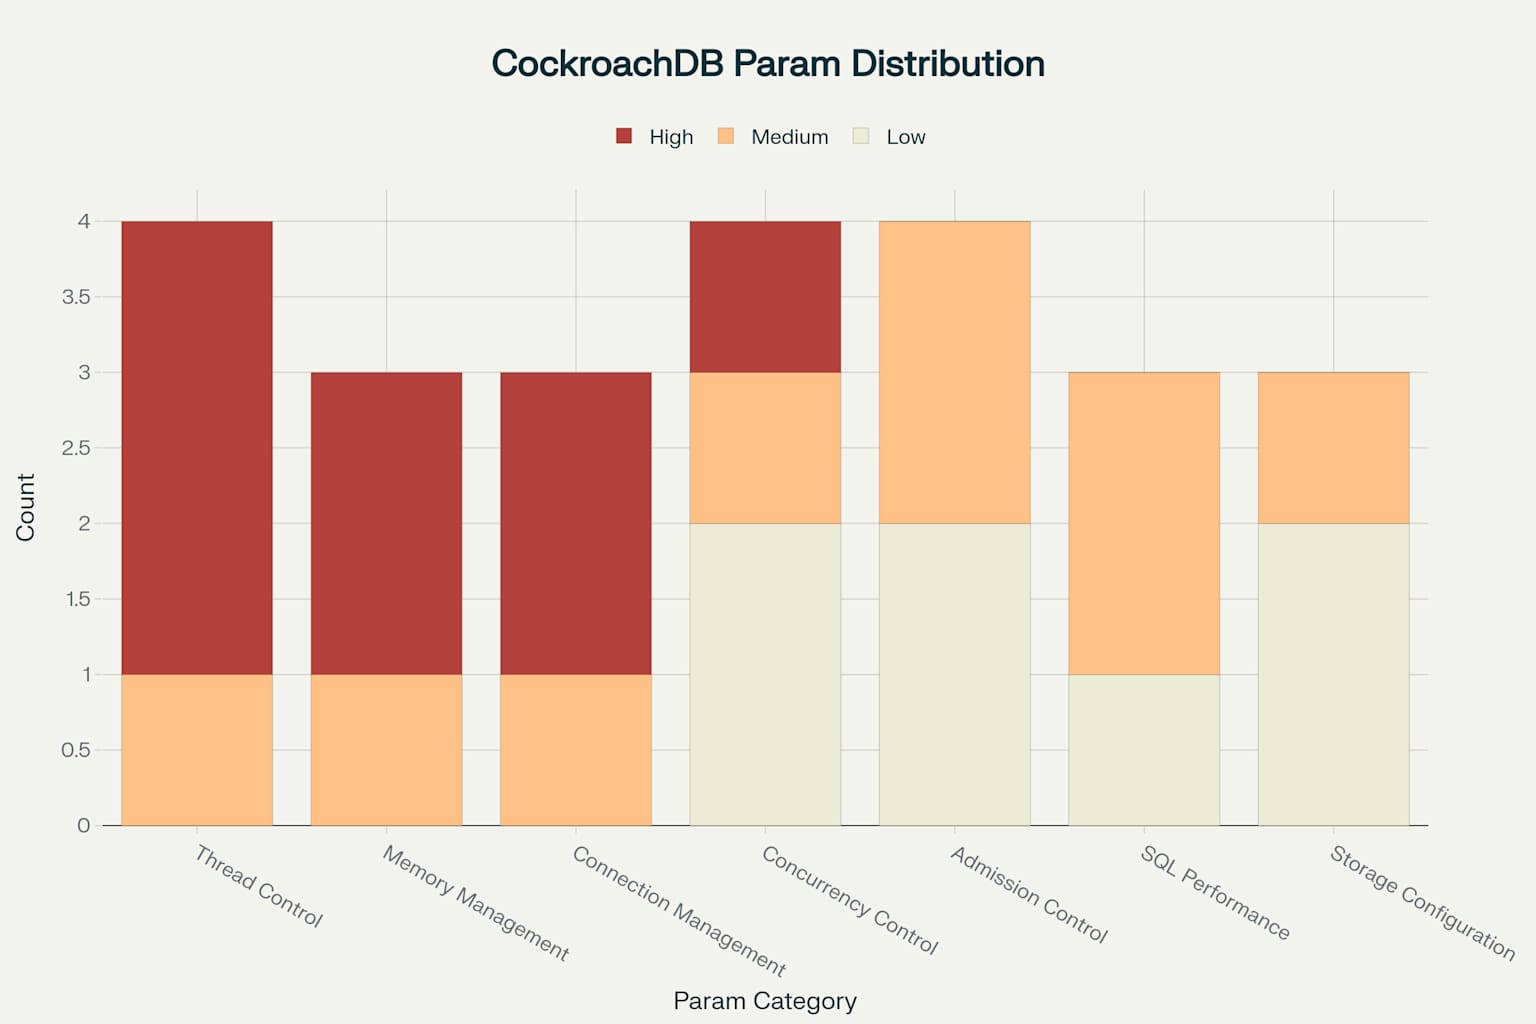
Critical Thread Tuning Parameters
Memory Management Configuration
Memory allocation directly impacts thread performance in CockroachDB, as insufficient memory can lead to increased goroutine blocking and reduced concurrency [15][42]. The two most critical memory parameters are –cache and –max-sql-memory, both defaulting to 25% of system memory [12][15]. The cache parameter controls the RocksDB/Pebble storage engine cache, which stores frequently accessed data in memory to reduce disk I/O operations [15][42]. The SQL memory parameter manages memory allocation for query execution, including temporary data storage, result sets, and prepared statements [15][42].
Properly configuring these parameters prevents memory exhaustion that can cause goroutine starvation and degraded performance [41]. In containerized environments, explicit memory limits should be set to prevent the database from consuming more memory than allocated to the container [12][24]. For production deployments, monitoring memory utilization patterns helps determine optimal allocation between cache and SQL memory based on workload characteristics.
Go Runtime Thread Control
The GOMAXPROCS environment variable represents the most fundamental thread tuning parameter for CockroachDB [23][25]. This setting determines the maximum number of OS threads that can execute Go code simultaneously and directly impacts the database’s ability to utilize available CPU resources [25]. While Go automatically sets this to the number of CPU cores by default, explicit configuration becomes essential in specific deployment scenarios [25].
In containerized environments, GOMAXPROCS should be set to match the container’s CPU limit rather than the host machine’s total cores [23][24]. This prevents the Go runtime from creating more threads than the container can effectively utilize, reducing context switching overhead and improving performance predictability. When running multiple CockroachDB nodes on a single machine, GOMAXPROCS must be configured proportionally to prevent excessive CPU competition between instances [23].
Concurrency and Distributed Operations
CockroachDB’s distributed architecture requires careful tuning of parameters that control concurrent operations across the cluster [6][33]. The kv.dist_sender.concurrency_limit parameter controls the maximum number of concurrent DistSender operations, defaulting to 64 times the number of CPU cores [43]. This high default value may be excessive for many workloads and can lead to memory pressure under heavy concurrent load [43].
The distributed SQL execution system, controlled by sql.defaults.distsql, enables query processing across multiple nodes to improve performance and reduce network traffic [2][6]. Vectorized query execution (sql.defaults.vectorize) processes batches of columnar data instead of single rows, significantly improving computational efficiency for analytical workloads [6][15]. Both features are enabled by default and provide substantial performance benefits for multi-node deployments.
Admission Control and Load Management
CockroachDB’s admission control system serves as a critical component for maintaining thread performance under varying load conditions [9][19]. The system monitors three types of resource overload: CPU utilization, storage I/O, and replication backlog [9]. When any of these resources becomes saturated, admission control queues new work by priority to ensure critical operations continue processing while managing resource consumption [19].
CPU overload detection relies on two primary indicators: the ratio of runnable goroutines per CPU and goroutine scheduling latency [9]. When runnable goroutines exceed 32 per CPU, the system activates admission control to prevent further degradation [9]. Storage overload monitoring focuses on preventing LSM tree read amplification that can severely impact read performance [19]. Administrators can configure admission control behavior through cluster settings to match specific workload requirements and performance objectives.
Monitoring Thread Performance
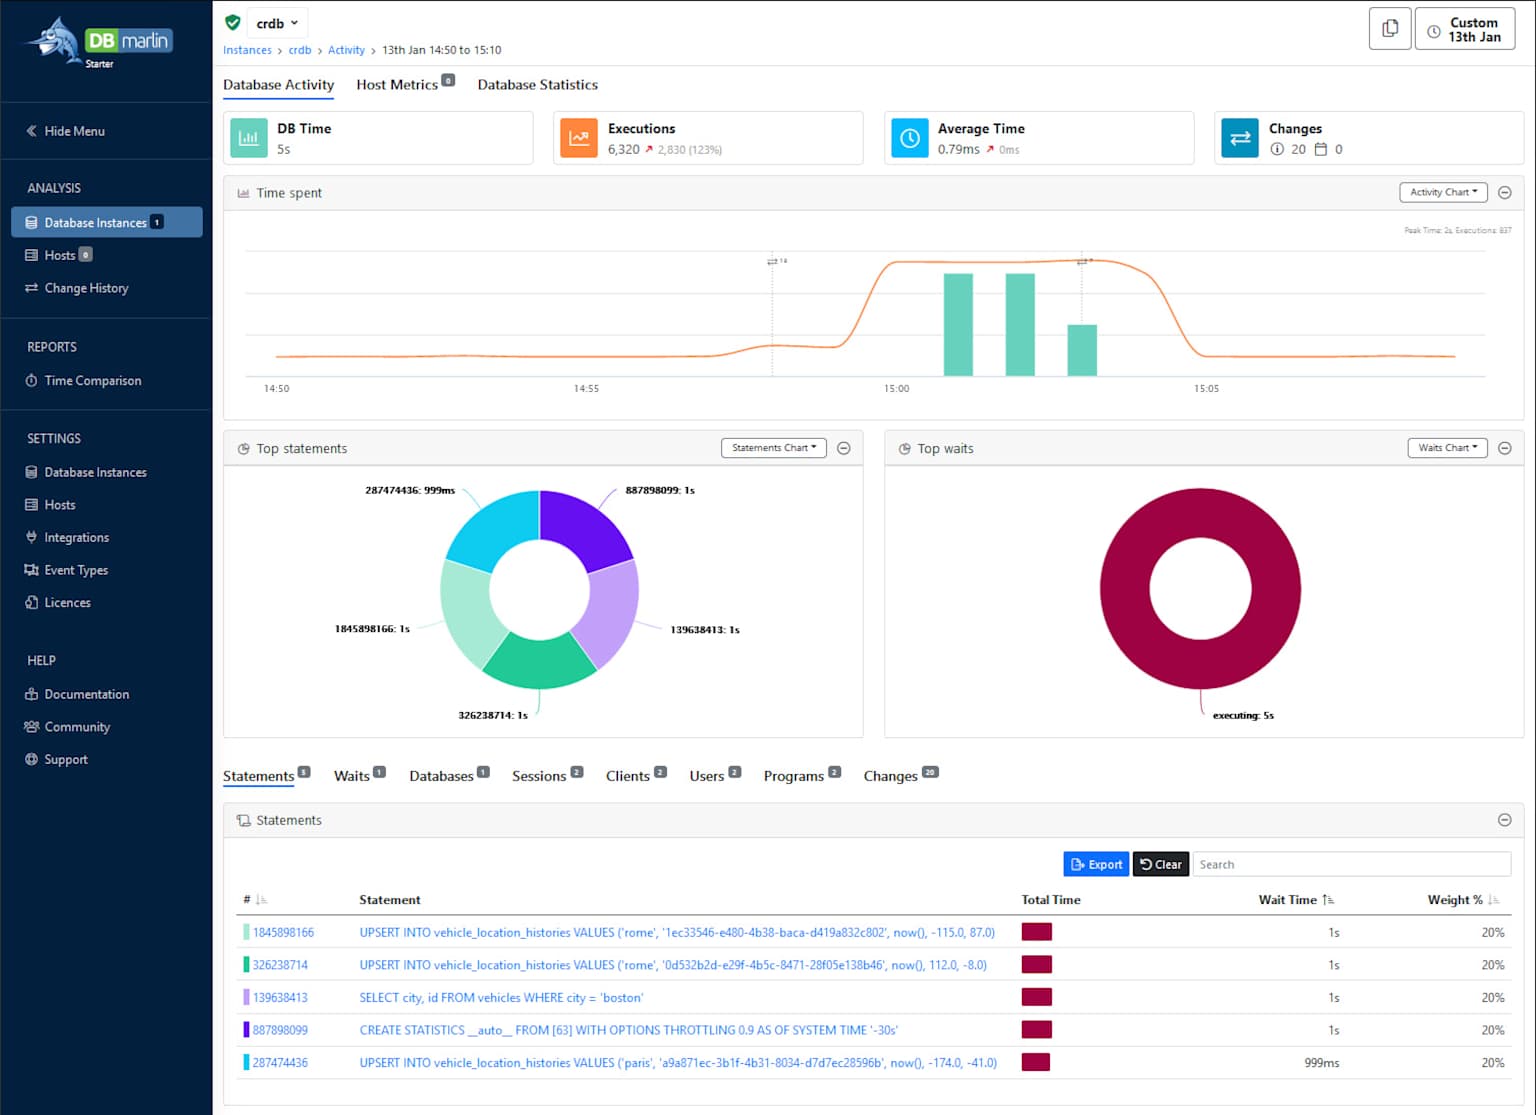
Effective thread performance monitoring requires tracking multiple interconnected metrics that provide insights into goroutine behavior, resource utilization, and admission control activation [28][29]. Essential CPU and thread metrics include sys.cpu.combined.percent-normalized for overall CPU utilization and goroutines for active goroutine count [28]. The runnable_goroutines_per_cpu metric serves as a key indicator for admission control activation and potential CPU saturation [9].
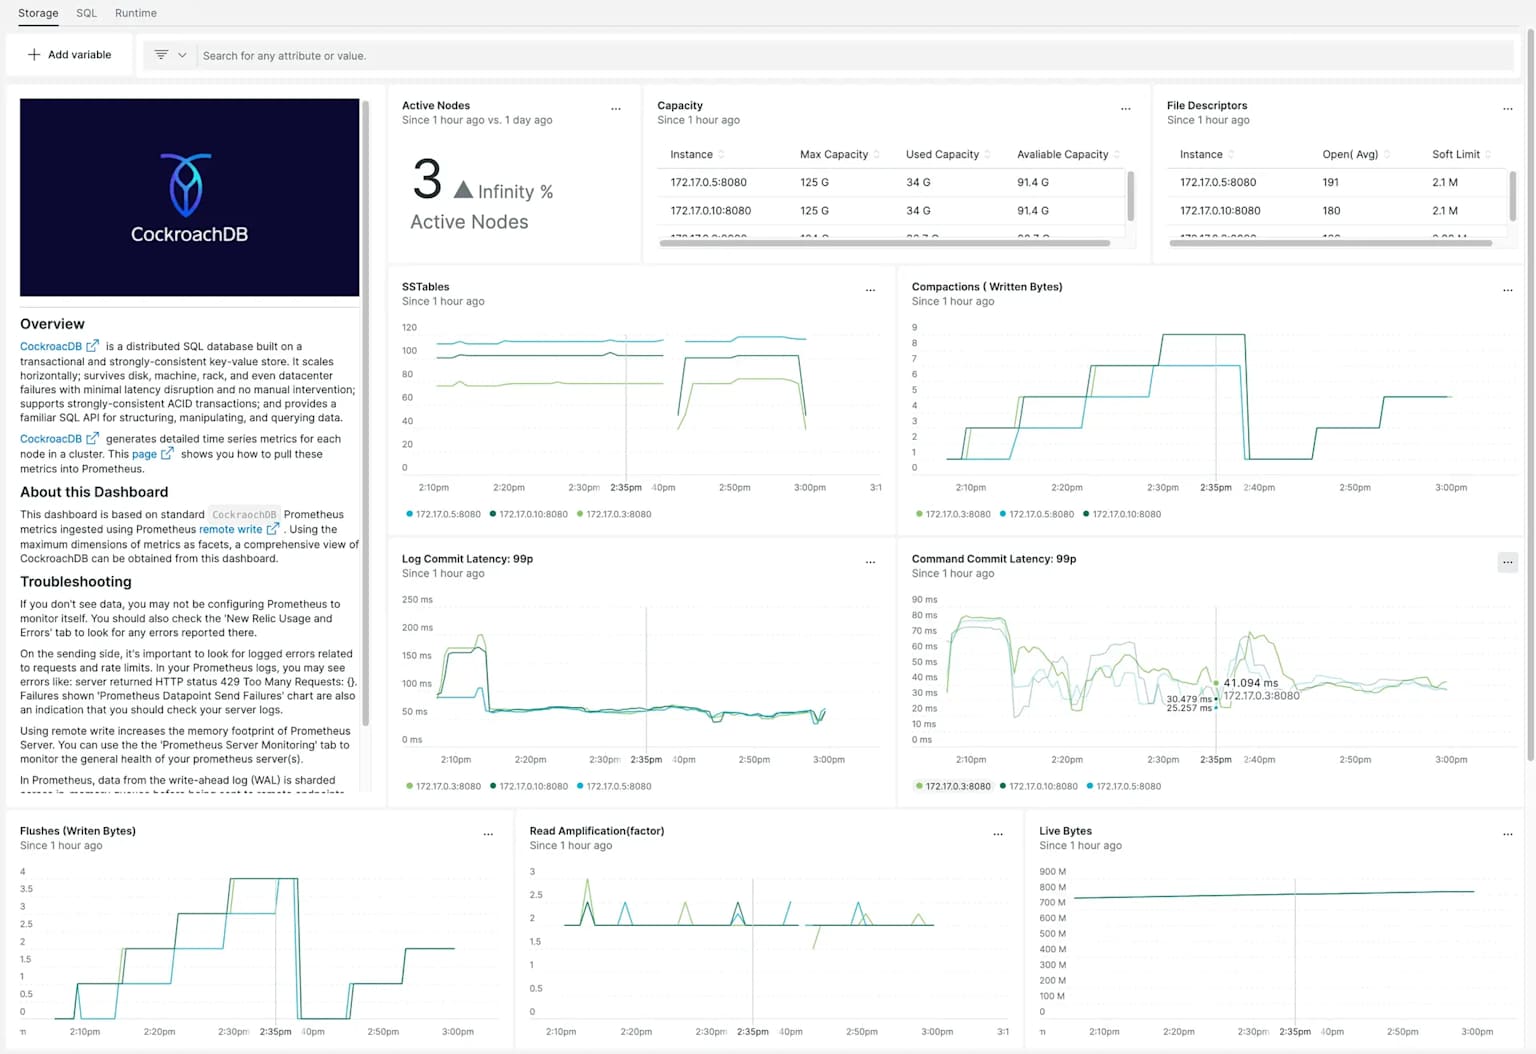
Memory monitoring focuses on sys.memory.available for system memory status, sql.mem.current for active SQL memory usage, and storage.cache.size for cache utilization [28][29]. Admission control metrics such as admission.io.overload and kv.dist_sender.batches.sent provide visibility into system load management and distributed operation patterns [29]. These metrics can be exported to external monitoring systems like Prometheus and Grafana for comprehensive cluster observability [30][34].
Regular monitoring of these metrics enables proactive identification of performance bottlenecks before they impact application performance. Establishing baseline performance profiles during normal operations facilitates rapid detection of anomalous behavior and guides tuning decisions [30]. Automated alerting on critical thresholds ensures timely response to performance degradation events.
Connection Pool Optimization
Application-level connection pooling significantly impacts CockroachDB’s thread utilization and overall cluster performance [5][8]. The recommended starting point for connection pool sizing is 10 connections per application instance, with a maximum pool size calculated as 4 times the total cluster vCPUs divided by the number of pool instances [8]. Connection timeout settings should balance responsiveness with resource utilization, typically starting with 30-second timeouts [8].
Node-aware connection pooling, implemented through libraries like crdbpool, provides substantial performance improvements by distributing connections evenly across cluster nodes [5][22]. This approach reduces hotspots that can develop when applications concentrate connections on specific nodes, leading to uneven resource utilization and reduced overall throughput [22]. Advanced connection pooling includes health checking and automatic retry logic to handle node failures gracefully [5].
Connection pool monitoring should track utilization rates, timeout frequencies, and connection creation latency to identify optimization opportunities [8]. Oversized pools can lead to resource waste and increased memory consumption, while undersized pools create bottlenecks that limit application concurrency [8]. Regular analysis of connection patterns helps optimize pool configurations for specific workload characteristics.
Configuration Examples and Best Practices
Production CockroachDB deployments require careful configuration of thread-related parameters based on deployment environment and workload characteristics [17][18]. For containerized deployments using Kubernetes, explicit resource limits and GOMAXPROCS configuration prevent resource overcommitment and ensure predictable performance [7][24]. Container configurations should specify both CPU and memory limits to enable proper resource management by the Kubernetes scheduler.
Multi-node deployments on shared hardware require proportional GOMAXPROCS allocation to prevent CPU competition between instances [23]. Memory allocation should account for the total number of nodes per machine while maintaining recommended ratios for cache and SQL memory [12][15]. Network configuration must consider inter-node communication patterns and potential bandwidth constraints that can impact distributed operations.
Workload-specific tuning considers the differences between OLTP and OLAP access patterns [2][3]. OLTP workloads typically benefit from higher connection counts and aggressive caching, while OLAP workloads may require larger SQL memory allocations and optimized distributed execution settings [3]. Regular performance testing under realistic load conditions validates configuration changes and identifies optimization opportunities [18][21].
Troubleshooting Thread Performance Issues
Common thread performance issues in CockroachDB manifest as high CPU utilization, memory exhaustion, or connection pool saturation [9][41]. High CPU utilization often correlates with excessive goroutine creation or inefficient scheduling, indicated by elevated runnable_goroutines_per_cpu metrics [9]. Solutions include verifying GOMAXPROCSsettings, reviewing admission control activation, and potentially reducing the kv.dist_sender.concurrency_limitparameter [43].
Memory exhaustion can result from inadequate –max-sql-memory configuration, connection leaks, or inefficient query patterns [15][41]. Systematic monitoring of SQL memory usage patterns helps identify memory-intensive operations that may require optimization [42]. Large result sets and complex queries may necessitate increased memory allocation or query restructuring to improve efficiency.
Connection pool issues typically present as increased latency or connection timeout errors [8]. Diagnostic steps include analyzing pool utilization metrics, verifying timeout configurations, and implementing connection retry logic [5]. Node-aware pooling can resolve uneven load distribution that creates artificial capacity constraints [22]. Regular review of application connection patterns ensures optimal pool sizing for evolving workload requirements.
Conclusion
Optimizing thread operations in CockroachDB requires a comprehensive understanding of the database’s Go-based concurrency model, distributed architecture, and admission control mechanisms. Success depends on careful configuration of memory management parameters, appropriate GOMAXPROCS settings, and effective monitoring of goroutine behavior and resource utilization. The integration of admission control systems, connection pool optimization, and workload-specific tuning creates a foundation for sustained high performance across varying operational conditions.
The most impactful optimizations focus on memory allocation through –cache and –max-sql-memory parameters, Go runtime configuration via GOMAXPROCS, and application-level connection pooling strategies. Continuous monitoring using CockroachDB’s extensive metrics framework enables proactive identification of performance bottlenecks and validation of tuning efforts. Organizations implementing these practices can achieve significant improvements in throughput, latency, and resource utilization while maintaining the reliability and consistency that CockroachDB provides in distributed environments.
Further Reading
TiDB Selection Framework for Enterprise Architecture
Tuning TiDB Server Parameters for Optimal Performance
Galera Cluster for MySQL 8.0.42-26.23 and 8.4.5-26.23
Building Horizontally Scalable RDS Infrastructure
Vector Index Algorithms in Milvus
Sources:
[1] Performance Tuning Recipes – CockroachDB https://www.cockroachlabs.com/docs/stable/performance-recipes
[2] Optimize Statement Performance Overview – CockroachDB https://www.cockroachlabs.com/docs/stable/make-queries-fast
[3] SQL Performance Best Practices – CockroachDB https://www.cockroachlabs.com/docs/stable/performance-best-practices-overview
[4] Benchmarking Overview – CockroachDB https://www.cockroachlabs.com/docs/stable/performance
[5] authzed/crdbpool: node aware connection pooling for CockroachDB https://github.com/authzed/crdbpool
[6] Parallel Query Execution in CockroachDB – Kai Niemi’s Blog https://blog.cloudneutral.se/parallel-query-execution-in-cockroachdb
[7] CockroachDB Performance on Kubernetes https://www.cockroachlabs.com/docs/stable/kubernetes-performance
[8] Connection pooling with Spring Boot and CockroachDB https://blog.cloudneutral.se/connection-pooling-with-spring-boot-and-cockroachdb
[9] How it protects against unexpected overload – CockroachDB https://www.cockroachlabs.com/blog/admission-control-unexpected-overload/
[10] Build a Simple CRUD Go App with CockroachDB and the Go pgx … https://www.cockroachlabs.com/docs/stable/build-a-go-app-with-cockroachdb
[11] Build a Go App with CockroachDB and GORM https://www.cockroachlabs.com/docs/stable/build-a-go-app-with-cockroachdb-gorm
[12] Resource Management – CockroachDB https://www.cockroachlabs.com/docs/stable/configure-cockroachdb-kubernetes
[13] SET CLUSTER SETTING – CockroachDB https://www.cockroachlabs.com/docs/stable/set-cluster-setting
[14] Cluster Settings – CockroachDB https://www.cockroachlabs.com/docs/stable/cluster-settings
[15] Memory usage in CockroachDB https://www.cockroachlabs.com/blog/memory-usage-cockroachdb/
[16] Thread pool settings | Elastic Documentation https://www.elastic.co/docs/reference/elasticsearch/configuration-reference/thread-pool-settings
[17] Production Checklist – CockroachDB https://www.cockroachlabs.com/docs/cockroachcloud/production-checklist
[18] Performance Benchmarking with TPC-C – CockroachDB https://www.cockroachlabs.com/docs/stable/performance-benchmarking-with-tpcc-large
[19] Admission Control – CockroachDB https://www.cockroachlabs.com/docs/stable/admission-control
[20] storage: v20.2.3: “too many open files” when destroying an iterator … https://github.com/cockroachdb/cockroach/issues/58029
[21] Investigating CockroachDB Performance and Stability With 22k … https://dzone.com/articles/investigating-cockroachdb-performance-and-stabilit
[22] How to Maximize CockroachDB Performance | AuthZed.com https://authzed.com/blog/maximizing-cockroachdb-performance
[23] set GOMAXPROCS when multiple nodes are on 1 machine #8265 https://github.com/cockroachdb/docs/issues/8265
[24] add guidance for CPU requirements on single-cluster k8s deployment https://github.com/cockroachdb/docs/issues/5922
[25] What is the GOMAXPROCS default value? – Stack Overflow https://stackoverflow.com/questions/17853831/what-is-the-gomaxprocs-default-value
[26] Context Scalability extensions using CockroachDB + Removal of … https://labs.etsi.org/rep/tfs/controller/-/merge_requests/34/diffs?diff_id=707&start_sha=7730ad87a46dbbc0220d8b9445a1de16df8de225&file=badca3216d4118ac92ef442f1c4ed87c73f1c447
[27] cockroach/docs/RFCS/20170124_sql_parallelization.md at master https://github.com/cockroachdb/cockroach/blob/master/docs/RFCS/20170124_sql_parallelization.md
[28] Essential Metrics for CockroachDB Self-Hosted Deployments https://www.cockroachlabs.com/docs/stable/essential-metrics-self-hosted
[29] Metrics – CockroachDB https://www.cockroachlabs.com/docs/stable/metrics
[30] Monitoring and Alerting – CockroachDB https://www.cockroachlabs.com/docs/stable/monitoring-and-alerting
[31] CockroachDB monitoring and integration with Zabbix https://www.zabbix.com/integrations/cockroachdb
[32] Display CockroachDB metrics in Splunk Dashboards https://dev.to/cockroachlabs/display-cockroachdb-metrics-in-splunk-dashboards-12ib
[33] Local and distributed query processing in CockroachDB https://www.cockroachlabs.com/blog/local-and-distributed-processing-in-cockroachdb/
[34] Monitor CockroachDB with Prometheus https://www.cockroachlabs.com/docs/stable/monitor-cockroachdb-with-prometheus
[35] cockroach node – CockroachDB https://www.cockroachlabs.com/docs/stable/cockroach-node
[36] cockroach start – CockroachDB https://www.cockroachlabs.com/docs/stable/cockroach-start
[37] cockroach Commands Overview – CockroachDB https://www.cockroachlabs.com/docs/stable/cockroach-commands
[38] environment variables for certs dir and addr and other cli flags … https://github.com/cockroachdb/cockroach/issues/2706
[39] cockroach start-single-node – CockroachDB https://www.cockroachlabs.com/docs/stable/cockroach-start-single-node
[40] cockroach init – CockroachDB https://www.cockroachlabs.com/docs/stable/cockroach-init
[41] Known Limitations in CockroachDB v25.2 https://www.cockroachlabs.com/docs/stable/known-limitations
[42] Memory Management in CockroachDB – DEV Community https://dev.to/jhatcher9999/memory-management-in-cockroachdb-29c4
[43] kvcoord,admission: reconsider the DistSender concurrency limit … https://github.com/cockroachdb/cockroach/issues/85470
[44] SQL performance best practices: performance tuning to speed up … https://www.cockroachlabs.com/blog/sql-performance-database-best-practices/
[45] Transactions – CockroachDB https://www.cockroachlabs.com/docs/stable/transactions
[46] Rubbing control theory on the Go scheduler – CockroachDB https://www.cockroachlabs.com/blog/rubbing-control-theory/
[47] How can I debug cockroachDB? — many goroutine jump each other https://github.com/cockroachdb/cockroach/issues/38048
[48] Production Checklist – CockroachDB https://www.cockroachlabs.com/docs/stable/recommended-production-settings
[49] Here’s how CockroachDB keeps your database from collapsing … https://www.cockroachlabs.com/blog/admission-control-in-cockroachdb/
[50] What’s New in v21.1 – CockroachDB https://www.cockroachlabs.com/docs/releases/v21.1
[51] Overload Dashboard – CockroachDB https://www.cockroachlabs.com/docs/stable/ui-overload-dashboard
[52] The architecture of a distributed SQL database, part 1 – CockroachDB https://www.cockroachlabs.com/blog/distributed-sql-key-value-store/
[53] cockroach sql – CockroachDB https://www.cockroachlabs.com/docs/stable/cockroach-sql