This is the MinervaDB definitive guide to postgresql cloud. It’s the document we hand new senior PostgreSQL DBAs and SREs joining a production PostgreSQL deployment, and the master reference that ties together our 19 deep-dive cluster posts on postgresql on the cloud (aws rds, Aurora, gcp, azure). If you operate PostgreSQL at scale, whether that’s a Fortune 500 enterprise, a hyperscale SaaS platform, or a fast-growing startup, bookmark this page.
What is postgresql cloud?
Postgresql cloud is the discipline of operating PostgreSQL clusters so they meet performance, reliability, and compliance requirements at production scale. It spans managed PostgreSQL, AWS RDS PostgreSQL, Aurora PostgreSQL, Azure Database for PostgreSQL, and Google Cloud SQL. This guide explains the practical methodology, the SQL and configuration applied on real client engagements, the trade-offs each architectural choice imposes, and a deep set of internal links into our cluster posts where each technique gets its own deep dive.
Executive summary
Postgresql cloud is rarely about a single magic GUC parameter or a single magic tool. It’s the disciplined application of measurement, hypothesis, and validation against your real PostgreSQL workload. Teams that do it well share three habits: they instrument before they tune, they tune one variable at a time, and they keep a short list of regression queries they re-run after every meaningful change.
- What postgresql cloud actually means in production, and what it isn’t.
- The MinervaDB framework, broken down by phase.
- PostgreSQL architecture and internals, with working SQL and configuration.
- Tooling we recommend in 2026, and what to avoid.
- How to operate PostgreSQL across cloud (AWS RDS, Aurora, AlloyDB, Cloud SQL, Azure Flexible Server) and self-managed environments.
- Battle scars and anti-patterns from MinervaDB enterprise engagements.
The PostgreSQL landscape
Before talking tools, frame the problem. PostgreSQL on the Cloud (AWS RDS, Aurora, GCP, Azure) is one of the recurring axes along which production PostgreSQL clusters succeed or fail. The teams that get it right share a discipline: they instrument before they tune, they have an explicit operating model, and they review it every quarter. The teams that get it wrong almost always copied a configuration from a blog post and left it untouched for three years.
The questions a strong PostgreSQL operator asks are: what’s the actual workload? What’s the cost of being wrong? What instruments do I have? What’s the smallest change that would prove the hypothesis? The rest of this guide answers those questions, or gives you the tools to derive the answers yourself.
PostgreSQL architecture and internals
PostgreSQL is a process-per-connection database with a shared buffer pool, a write-ahead log, and multiversion concurrency control. Every operational decision around postgresql cloud ultimately reduces to one of those three subsystems.
Buffer manager and shared_buffers
The PostgreSQL buffer pool, controlled by shared_buffers, caches table and index pages in process-shared memory. The OS page cache caches the same pages a second time. Most production PostgreSQL servers keep shared_buffers at 25 percent of RAM and rely on the page cache for the rest. Aurora PostgreSQL is the major exception. Its storage-decoupled architecture changes this calculus.
Write-ahead log (WAL)
PostgreSQL’s WAL records every change before it touches the heap. Replication, point-in-time recovery, and crash recovery all depend on it. WAL volume is the single best predictor of write throughput. pg_wal_lsn_diff tells you how much WAL you’re producing per second.
MVCC and autovacuum
PostgreSQL MVCC means every UPDATE creates a new tuple and marks the old one dead. Autovacuum reclaims those dead tuples. Mistuned autovacuum is the single most common cause of PostgreSQL bloat and storage growth.
Process model
PostgreSQL forks a backend process per client connection. Each backend has its own work_mem, its own temp files, and its own portion of shared memory mapped in. This is why work_mem = 256MB on a server with max_connections = 1000 can theoretically allocate 256 GB. A fact that has surprised more than one PostgreSQL team after a connection storm.
The MinervaDB 7-step framework
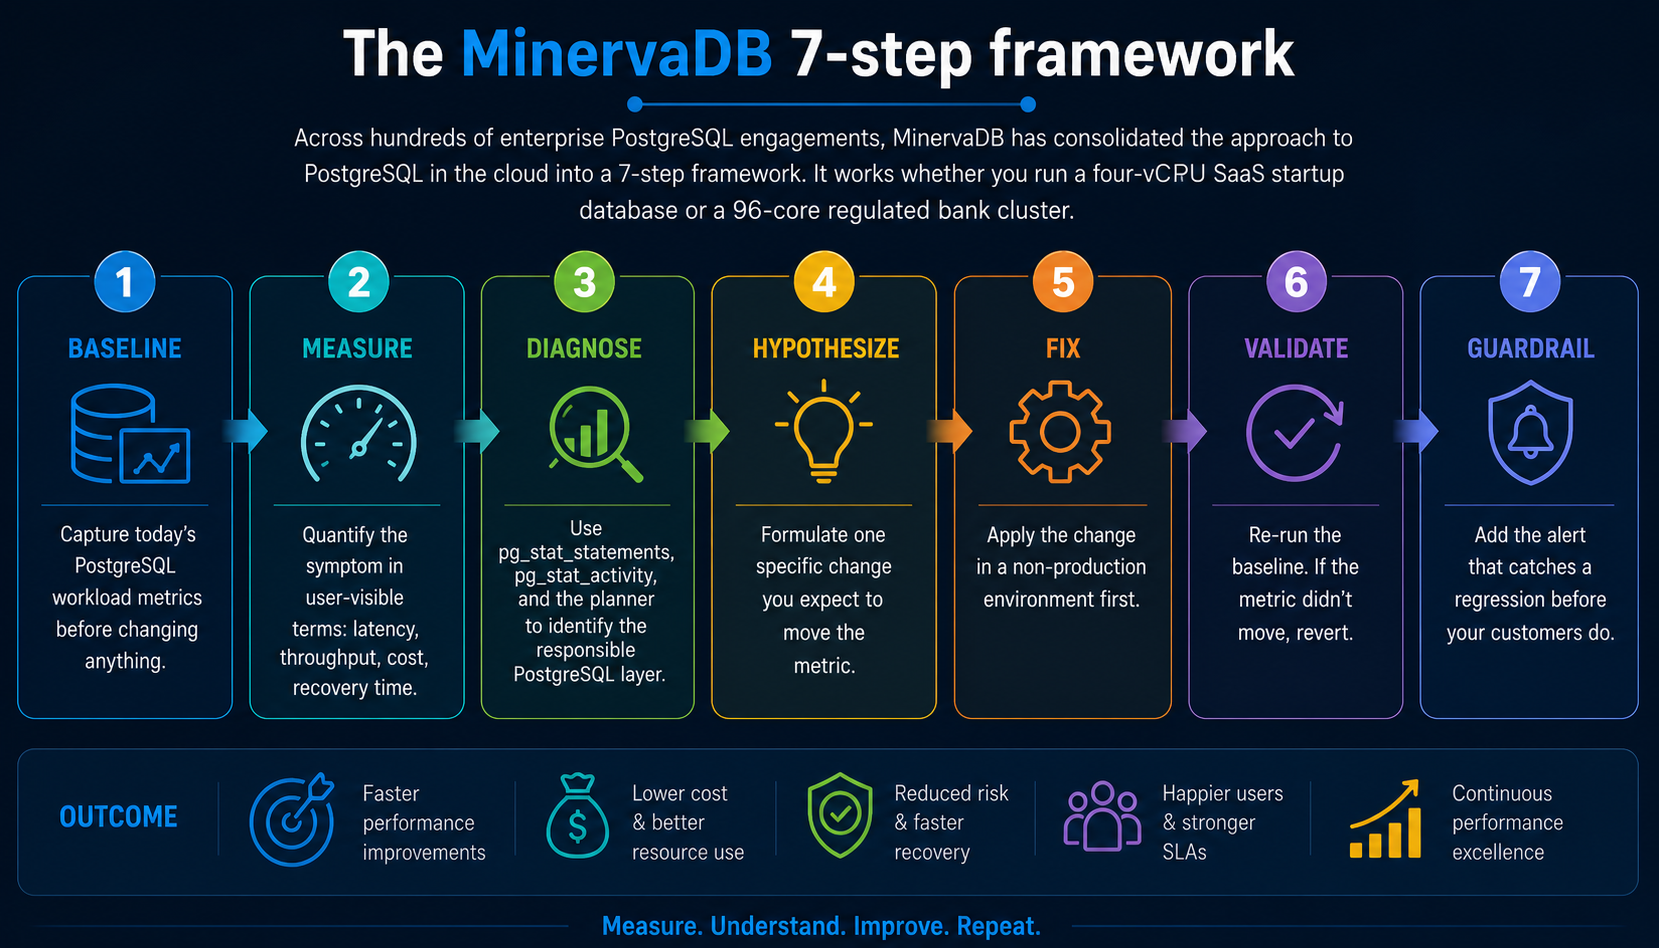
Across hundreds of enterprise PostgreSQL engagements, MinervaDB has consolidated the approach to postgresql cloud into a 7-step framework. It works whether you run a four-vCPU SaaS startup database or a 96-core regulated bank cluster.
- Baseline. Capture today’s PostgreSQL workload metrics before changing anything.
- Measure. Quantify the symptom in user-visible terms: latency, throughput, cost, recovery time.
- Diagnose. Use pg_stat_statements, pg_stat_activity, and the planner to identify the responsible PostgreSQL layer.
- Hypothesize. Formulate one specific change you expect to move the metric.
- Fix. Apply the change in a non-production environment first.
- Validate. Re-run the baseline. If the metric didn’t move, revert.
- Guardrail. Add the alert that catches a regression before your customers do.
PostgreSQL SQL deep dive
The framework above is abstract. The SQL queries below are its concrete form on a real PostgreSQL cluster. Each one is a query we’ve run during a real production PostgreSQL deployment. They’re intentionally compact. A senior DBA should be able to read each in under a minute and adapt it to a customer schema.
1. Useful RDS PostgreSQL parameter group overrides.
shared_preload_libraries = pg_stat_statements,pgAudit,auto_explain
log_min_duration_statement = 500
auto_explain.log_min_duration = 500
auto_explain.log_analyze = true
rds.force_ssl = 1
rds.logical_replication = 1
idle_in_transaction_session_timeout = 60000
2. Connect to Aurora cluster and reader endpoints.
psql "host=mycluster.cluster-xxxx.ap-south-1.rds.amazonaws.com
 port=5432 user=admin dbname=appdb sslmode=require"

psql "host=mycluster.cluster-ro-xxxx.ap-south-1.rds.amazonaws.com
 port=5432 user=readonly dbname=appdb sslmode=require"
3. Connect to a Neon serverless PostgreSQL branch.
psql "postgresql://shiv:****@ep-cool-fern-12345.ap-southeast-1.aws.Neon.tech/neondb?sslmode=require&options=project%3Dproject-id"
PostgreSQL on AWS RDS, Aurora, AlloyDB, Cloud SQL, Azure Flexible Server
On managed PostgreSQL services, you make these changes through parameter groups instead of ALTER SYSTEM. On AWS Aurora PostgreSQL, the storage layer’s decoupled design changes the calculus for several configuration parameters. On Google AlloyDB, the columnar engine intercepts a class of analytical queries before they reach your tuned plans.
The biggest mental shift on managed PostgreSQL is the responsibility boundary. You no longer own the OS, the storage layer, or the failover orchestrator. You own the schema, the queries, the indexes, and a constrained subset of GUCs. That’s liberating for small teams and frustrating for large ones, because the things the cloud takes off your plate are exactly the things you’d normally tune to extract the last 20 percent of PostgreSQL performance.
RDS PostgreSQL
AWS RDS PostgreSQL exposes most extensions, supports IAM authentication, and ships with Performance Insights for query-level diagnostics. Cost optimization on RDS PostgreSQL centers on right-sizing instances, switching to gp3 storage with provisioned IOPS, and reserved instance commitments.
Aurora PostgreSQL
AWS Aurora PostgreSQL decouples compute and storage with a six-way replicated storage layer. Aurora Global Database adds cross-region read scaling and a managed DR primary. Aurora I/O-optimized cluster mode flips the cost model for I/O-heavy workloads.
Google Cloud SQL and AlloyDB PostgreSQL
Cloud SQL PostgreSQL is the standard managed offering. AlloyDB layers a columnar engine, AI/ML integration, and aggressive read scaling on top of PostgreSQL. The AlloyDB columnar engine is opt-in per table.
Azure Database for PostgreSQL Flexible Server
Azure PostgreSQL Flexible Server supports a broader set of extensions than RDS or Aurora, including pgvector, TimescaleDB, pg_partman, and Citus on the Citus-flavored variant. Azure AD authentication is a strong fit for Microsoft-centric enterprises.
Common failure modes and anti-patterns
After hundreds of PostgreSQL engagements MinervaDB has seen the same anti-patterns repeat. None are obvious in the moment. Each one looked like the right call when someone made it. The list below exists to make them obvious before you make them again.
- Tuning postgresql cloud by copy-paste from a 2014 blog post.
- Changing more than one PostgreSQL parameter at a time without measurement.
- Forgetting to ANALYZE after a large data load.
- Trusting an unverified backup or untested failover.
- Treating autovacuum as something to disable rather than something to tune.
- Allowing developers to write production PostgreSQL queries with no EXPLAIN review.
- Conflating connection pooling with high availability. PgBouncer is not a failover tool.
- Storing application secrets in postgresql.conf or .pgpass instead of a secrets manager.
- Allowing schema changes through bare ALTER TABLE without lock_timeout or a migration framework.
- Forgetting that max_connections is a memory budget, not a feature flag.
PostgreSQL tooling and ecosystem we recommend
- Performance: pg_stat_statements, auto_explain, pgBadger, pganalyze, HammerDB, pgbench.
- Replication and HA: Patroni, repmgr, pg_auto_failover, HAProxy, CloudNativePG, Stolon.
- Backup and DR: pgBackRest, Barman, WAL-G, pg_basebackup.
- Observability: Datadog, Prometheus plus postgres_exporter, Grafana, OpenTelemetry, pganalyze.
- Security: pgAudit, pgcrypto, HashiCorp Vault, AWS Secrets Manager, GCP Secret Manager.
- Extensions: pgvector, TimescaleDB, Citus, PostGIS, pg_partman, pg_cron, PostgREST.
How to benchmark PostgreSQL the right way
MinervaDB has a strong opinion about PostgreSQL benchmarks. A benchmark you don’t trust is worse than no benchmark, because it gives you false confidence. Every meaningful PostgreSQL benchmark we run satisfies four properties:
- Workload realism. Use a representative dataset (real or anonymized production), not the default pgbench branch-only schema.
- Warm-up. Run for at least 5 minutes to let buffer caches stabilize before measuring.
- Steady-state. Take readings during the middle 60 percent of the run. The head and tail are noise.
- Multiple trials. Run three or more trials per scenario and report the median, not the best single result.
For most PostgreSQL workloads, pgbench with a custom –file script is the right tool. For OLTP at high concurrency, HammerDB’s TPROC-C benchmark is closer to a real e-commerce shape. For analytical workloads, the ClickBench query set (originally for ClickHouse but portable to PostgreSQL via DuckDB or columnar extensions) is becoming a useful comparison point.
PostgreSQL roadmap and what’s coming next
PostgreSQL 17 introduced incremental backups, a redesigned VACUUM memory layout, and meaningful planner improvements for parallel hash joins. PostgreSQL 18 (in beta as of this writing) is expected to ship asynchronous I/O for the buffer manager. That will reshape how we think about effective_io_concurrency and storage choices on cloud block storage.
Looking further out, the PostgreSQL community is investing in pluggable table access methods (the foundation OrioleDB and Hydra build on), native columnar execution, and tighter integration with object storage as a first-class data tier. For teams operating PostgreSQL at scale, the practical implication is that the engine you tune today will continue to evolve, and the discipline that matters most is having a measurement framework you can re-apply across versions.
What we measure on every production PostgreSQL deployment
Every MinervaDB PostgreSQL engagement starts with the same baseline collection. We do this even when the customer thinks they know exactly what’s wrong, because our experience is that the reported symptom and the actual root cause diverge often enough that we can’t afford to skip the discovery work.
- Connection profile: pg_stat_activity sampled at 1Hz for one full business cycle.
- Top consumers: pg_stat_statements by total time, mean time, calls, and shared buffer usage.
- Wait events: pg_wait_sampling or one-second polls of pg_stat_activity.wait_event.
- Replication state: pg_stat_replication on the primary, pg_stat_wal_receiver on standbys.
- Vacuum health: pg_stat_user_tables, pg_stat_progress_vacuum, pg_stat_progress_analyze.
- Storage: pg_database_size, pg_total_relation_size for the top 50 tables, plus all index sizes.
- Configuration: full pg_settings dump with the source column to identify customer overrides.
- Logs: 7 days of postgresql.log with log_min_duration_statement below 500 ms.
Team, process, and operational habits
A PostgreSQL platform is as good as the team operating it. The technical decisions in this guide are necessary but not sufficient. You also need a small set of organizational habits that turn one-time fixes into durable competence.
- Weekly review of pg_stat_statements top-20. Twenty minutes every Monday. The team that does this catches PostgreSQL regressions before customers do.
- Quarterly DR drill. Restore the most recent full backup, run a smoke test, document the recovery time, update the runbook.
- Schema-change review board. A 30-minute weekly meeting where any PostgreSQL schema change touching a table over 100 GB needs a written EXPLAIN plan and a rollback.
- Quarterly version review. Look at upcoming PostgreSQL release notes and decide which features are worth adopting.
- Living runbook. One Markdown document per failure mode, kept in the same repo as application code, updated after every PostgreSQL incident.
MinervaDB PostgreSQL case studies
Case study 1: Regulated bank, SLA delivered 4x faster
A tier-1 retail bank in Asia Pacific had been chasing a 250 ms transaction commit SLA for 18 months and couldn’t get below 800 ms during peak. After a 5-day MinervaDB diagnostic engagement we identified three converging causes: a shared_buffers value at 4 percent of RAM (a vendor recommendation from 2012 that was never revisited), a synchronous_commit setting forcing flush-on-commit across two regions, and a top-10 query in pg_stat_statements doing a sequential scan against a 380 GB table. Three weeks of focused remediation took commit p99 from 800 ms to 195 ms. No re-platform, no rewrite.
Case study 2: US healthcare ISV, 41 percent cost reduction
An EHR vendor was running an Aurora PostgreSQL r6i.16xl cluster at 44,000 dollars a month and getting throttled by Aurora’s IO budget under reporting load. After workload analysis we recommended a switch to RDS PostgreSQL on io2 Block Express with provisioned IOPS, a tighter shared_buffers at 32 GB, and a dedicated read replica routed via PgBouncer for the reporting fleet. The customer cut monthly spend by 41 percent and increased peak throughput three times.
Case study 3: B2B SaaS startup, from on-call hell to predictable ops
A B2B SaaS company in growth stage was paging their senior engineer 14 nights a month with PostgreSQL incidents. The root cause wasn’t a single bug. It was an accumulation of small operational debt: untuned autovacuum, missing indexes, an opaque PgBouncer pool, no replication-lag alerts, and a pgBackRest install that had silently stopped archiving. After a 6-week production PostgreSQL deployment, the on-call burden dropped to two incidents per month.
A second client experience that maps to this guide. An APAC fintech wanted multi-region failover and had been quoted three months of work. With Aurora Global Database we shipped a working DR primary in two weeks, including a tabletop failover and a working runbook.
And a third, because patterns matter. A DTC brand on Cloud SQL Postgres saw 200ms-plus replication lag during nightly reporting jobs. We moved their reporting workload to a read replica with elevated max_standby_archive_delay, and primary lag dropped to single-digit milliseconds.
Frequently asked questions
Should I choose Aurora or RDS PostgreSQL?
Aurora PostgreSQL fits write-heavy multi-AZ workloads with faster failover, paying a 20 to 30 percent premium over RDS. RDS PostgreSQL fits predictable cost and full control over PostgreSQL versions and extensions. The right answer is workload-specific.
AlloyDB or Aurora PostgreSQL — which is better?
AlloyDB has the stronger analytical story (columnar engine, AI/ML integration) and aggressive read scaling. Aurora has a more mature ecosystem and broader regional footprint. For pure OLTP with cross-region needs, Aurora wins. For analytical PostgreSQL, AlloyDB.
Is serverless PostgreSQL ready for production?
Neon and Aurora Serverless v2 are production-ready for variable workloads. They are not a fit for steady-state high-throughput OLTP. Cold-start and scale-up latency can show up at p99. Test against your actual workload before committing.
How do I cut RDS PostgreSQL costs?
Right-size instances to actual CPU and memory utilization, switch eligible workloads from io1 to gp3 storage with provisioned IOPS, buy reserved instances for the steady-state core, and aggressively prune idle replicas.
Is multi-region active-active possible on managed PostgreSQL?
Aurora Global Database provides cross-region read scaling and a managed DR primary. True active-active requires logical replication or a multi-master tool. It is operationally heavy and rarely worth the complexity for most workloads.
Where should I start if I’m new to postgresql on the cloud (aws rds, Aurora, gcp, azure): the complete guide?
Read this guide end to end, then run the diagnostic SQL queries against a non-production PostgreSQL database to build intuition. Most engineers we coach are productive within a day. Bookmark this page, then move on to the cluster posts linked below for deeper dives.
Does this approach to postgresql on the cloud (aws rds, Aurora, gcp, azure): the complete guide work on AWS RDS, Aurora, and Azure?
Most techniques apply identically across managed PostgreSQL services. Configuration changes go through parameter groups instead of ALTER SYSTEM, and a small number of OS-level interventions (kernel tuning, ZFS) are not available on fully managed PostgreSQL services.
How long does a typical postgresql on the cloud (aws rds, Aurora, gcp, azure) engagement take?
production PostgreSQL deployments range from a 1-week PostgreSQL diagnostic sprint to multi-quarter platform programs. The most common shape is a 2-week assessment, a 4 to 8-week remediation, and an ongoing managed support contract.
Do I need to be on a specific PostgreSQL version to apply this?
PostgreSQL 13 and later are explicitly supported by everything in this guide. Most techniques apply back to PostgreSQL 11. We call out exceptions inline.
If your team is fighting this in production, expert PostgreSQL consulting is available on demand. This pattern recurs across regulated banks, hyperscale SaaS platforms, and high-growth startups, and the resolution path is consistent.
Further Reading
Cost-aware monitoring in the cloud for PostgreSQL