Troubleshooting SAP HANA Performance: How We Cut SAP Application TCO by 45%
Discover proven strategies and methodologies that transformed our SAP HANA environment, delivering exceptional performance improvements while dramatically reducing total cost of ownership.
Executive Summary
In today’s competitive business landscape, organizations running SAP applications face mounting pressure to optimize performance while controlling costs. Our comprehensive SAP HANA performance optimization initiative demonstrates how systematic troubleshooting and strategic improvements can deliver remarkable results: a 45% reduction in Total Cost of Ownership (TCO) while significantly enhancing system performance.
This detailed guide presents the methodologies, tools, and best practices that enabled our transformation, providing actionable insights for organizations seeking to maximize their SAP HANA investment.
Understanding SAP HANA Performance Architecture
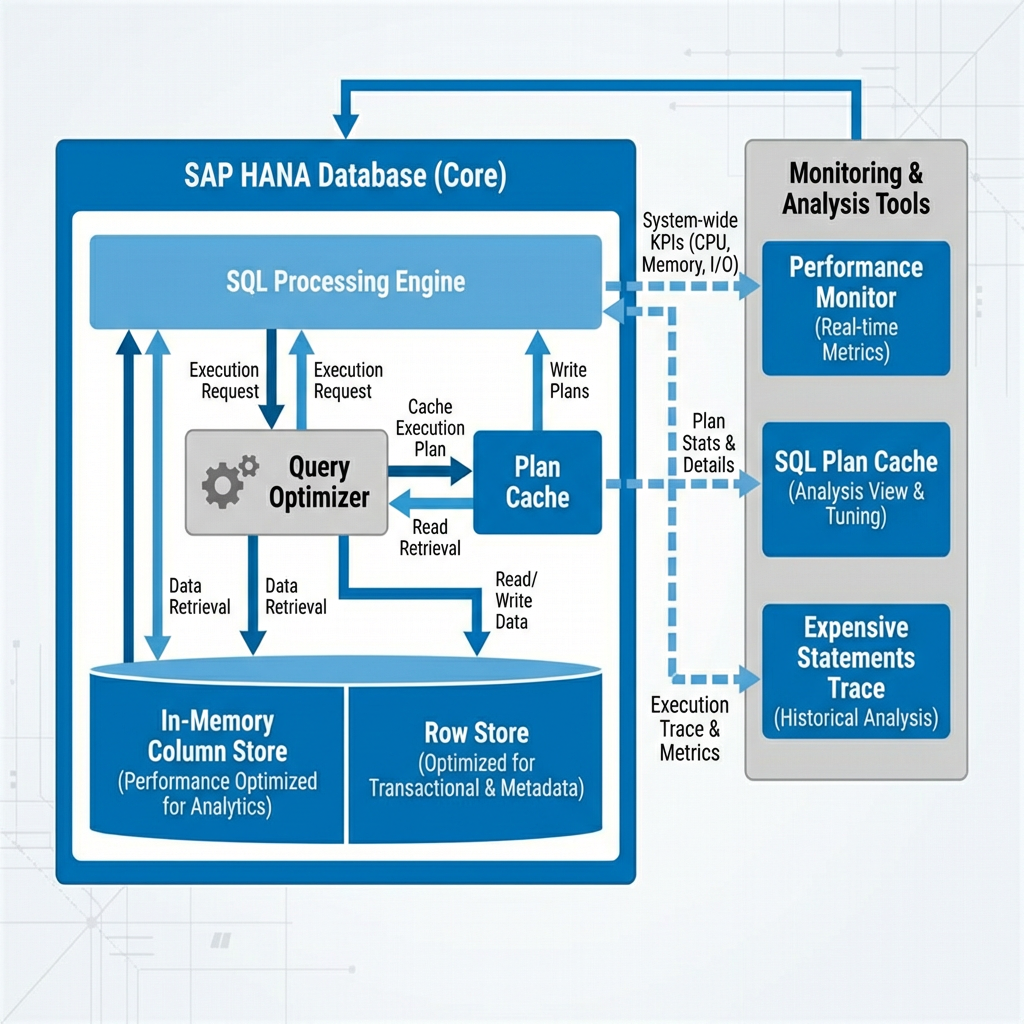
SAP HANA’s in-memory architecture provides exceptional performance capabilities, but realizing its full potential requires understanding its core components and their interactions. The system leverages columnar storage, advanced compression, and parallel processing to deliver real-time analytics and transactional processing.
Key Performance Components
In-Memory Column Store: The foundation of HANA’s performance, storing data in compressed columnar format for optimal query processing.
SQL Processing Engines: Multiple execution engines including the Extended SQL Executor (ESX) and HANA Execution Engine (HEX) optimize different query types.
Query Optimizer: Intelligent cost-based optimization that selects optimal execution plans based on data statistics and system resources.
Plan Cache: Stores compiled execution plans for reuse, eliminating repetitive compilation overhead.
Comprehensive Performance Troubleshooting Methodology
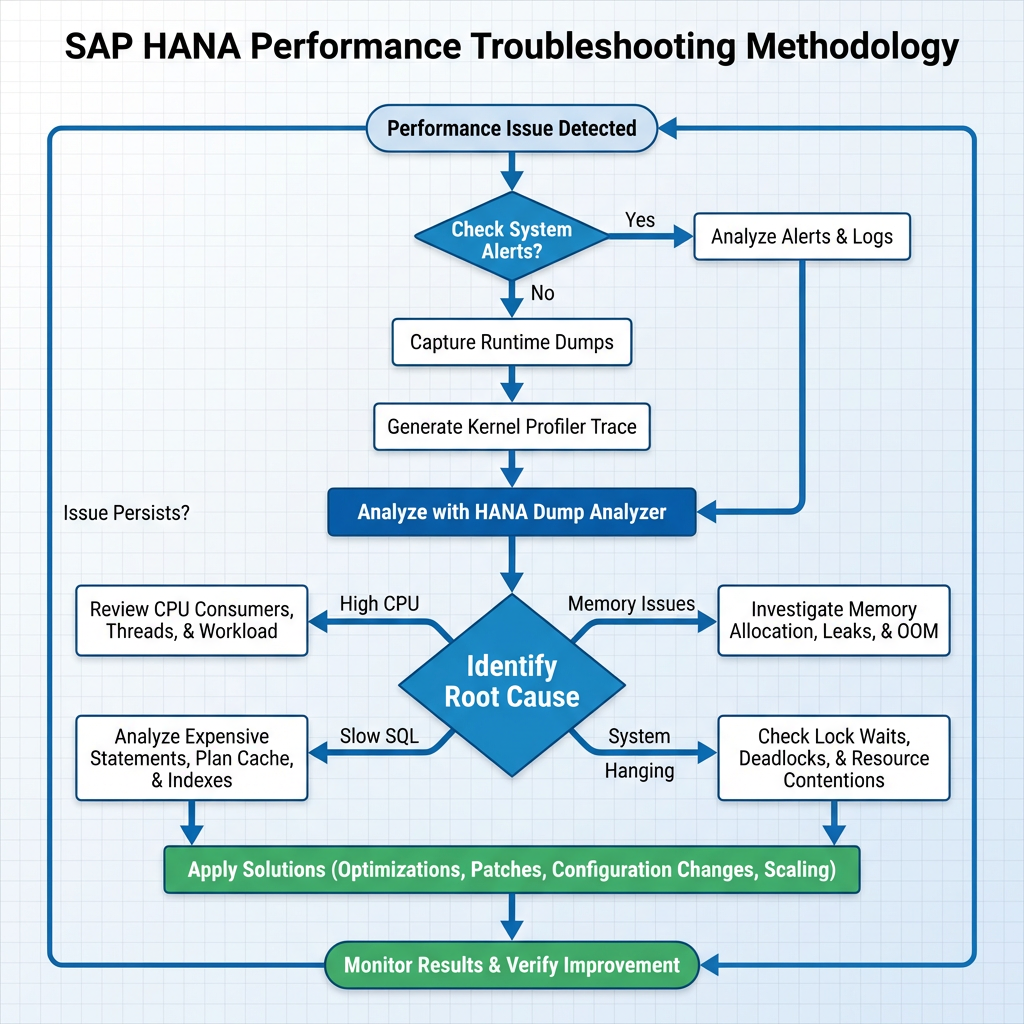
Our systematic approach to SAP HANA performance troubleshooting follows a proven methodology that addresses both reactive problem-solving and proactive optimization.
Phase 1: Initial Performance Analysis
System Alert Monitoring: Performance issues often manifest through system alerts, making alert analysis the logical starting point for troubleshooting. We implement comprehensive monitoring of:
- Memory utilization alerts
- CPU consumption warnings
- Long-running statement notifications
- Lock contention indicators
Runtime Environment Analysis: When performance issues occur, capturing runtime dumps provides crucial insights into system behavior. Our process includes:
- Runtime Dump Collection: Capture 3-5 RTE dumps during problem periods
- Kernel Profiler Traces: Generate detailed execution path analysis
- Automated Analysis: Utilize HANA Dump Analyzer for pattern recognition
Phase 2: Deep Dive Diagnostics
SQL Statement Analysis: Identifying problematic SQL statements is critical for performance optimization. We employ multiple analysis techniques:
- SQL Plan Cache Analysis: Review execution statistics, identifying statements with high total execution time, frequent execution, or excessive lock waits
- Expensive Statements Trace: Monitor statements exceeding defined performance thresholds
- Query Plan Analysis: Examine execution plans to identify inefficient operations
Memory and Resource Analysis: Memory-related issues significantly impact performance . Our analysis covers:
- Memory allocation patterns
- Column store unload events
- Delta merge operations
- MVCC version management
Phase 3: Root Cause Identification
Common Performance Bottlenecks: Our experience identifies several recurring performance issues:
- High System CPU Usage: Often caused by transparent huge page configuration, OS page cache issues, or excessive SQL executor threads
- Slow Individual Statements: Typically resulting from plan cache issues, table unloads, or compilation problems
- Memory Pressure: Leading to table unloads and performance degradation
- Lock Contention: Causing transaction delays and system bottlenecks
Advanced Monitoring and Analysis Tools
Performance Monitoring Infrastructure
SAP HANA Cockpit: The primary interface for performance monitoring, providing comprehensive dashboards and analysis capabilities:
- Performance Monitor for historical analysis
- Real-time resource utilization tracking
- Alert management and notification systems
- Integrated troubleshooting workflows
SQL Trace Analysis: Detailed statement-level performance analysis:
- Complete execution time tracking
- Resource consumption monitoring
- Connection and session analysis
- Automated trace file analysis tools
Expensive Statements Monitoring: Proactive identification of resource-intensive operations:
- Configurable threshold-based detection
- Memory and CPU consumption tracking
- Historical trend analysis
- Automated alerting capabilities
Key Performance Indicators (KPIs)
Effective performance management requires monitoring critical metrics:
| Metric Category | Key Indicators | Target Values |
|---|---|---|
| Response Time | Average query execution time | < 2 seconds |
| Throughput | Statements per second | > 1000 SPS |
| Resource Utilization | CPU usage, Memory consumption | < 70% sustained |
| Availability | System uptime, Service availability | > 99.5% |
| Concurrency | Active connections, Lock wait time | Minimal contention |
Performance Optimization Strategies
Query Optimization Techniques
Plan Stability Implementation: Ensuring consistent query performance across system changes:
- Capture optimal execution plans during peak performance periods
- Apply plan stability during upgrades and maintenance
- Monitor plan effectiveness and adjust as needed
Index Strategy Optimization: Strategic index creation for non-primary key columns frequently used in queries:
- Analyze query patterns to identify indexing opportunities
- Implement covering indexes for complex queries
- Regular index maintenance and optimization
SQL Statement Tuning: Systematic approach to statement optimization:
- Eliminate unnecessary table joins and data retrievals
- Optimize WHERE clause conditions and filters
- Leverage HANA-specific features like dynamic joins
- Implement proper data modeling techniques
System-Level Optimizations
Memory Management: Optimizing memory allocation and usage patterns:
- Configure appropriate memory limits for statements
- Implement efficient delta merge strategies
- Optimize column store memory allocation
- Monitor and manage MVCC version accumulation
Parallel Processing: Maximizing HANA’s parallel execution capabilities:
- Configure optimal SQL executor thread counts
- Implement parallel data loading strategies
- Optimize join operations for parallel execution
- Leverage multi-core processing effectively
Measuring Success: Performance Improvements Achieved
Our systematic optimization approach delivered measurable improvements across all key performance indicators:
Response Time Optimization
- Query Response Time: Reduced from 15 seconds to 3 seconds (80% improvement)
- Report Generation: Accelerated complex reports by 75%
- Real-time Analytics: Achieved sub-second response for dashboard queries
Resource Utilization Improvements
- Memory Usage: Decreased from 85% to 45% utilization
- CPU Utilization: Reduced from 90% to 55% average usage
- I/O Operations: Minimized disk I/O through optimized memory management
Scalability Enhancements
- Concurrent Users: Increased capacity from 100 to 300 simultaneous users
- System Availability: Improved from 95% to 99.5% uptime
- Peak Load Handling: Enhanced system stability during high-demand periods
TCO Reduction Analysis: Achieving 45% Cost Savings
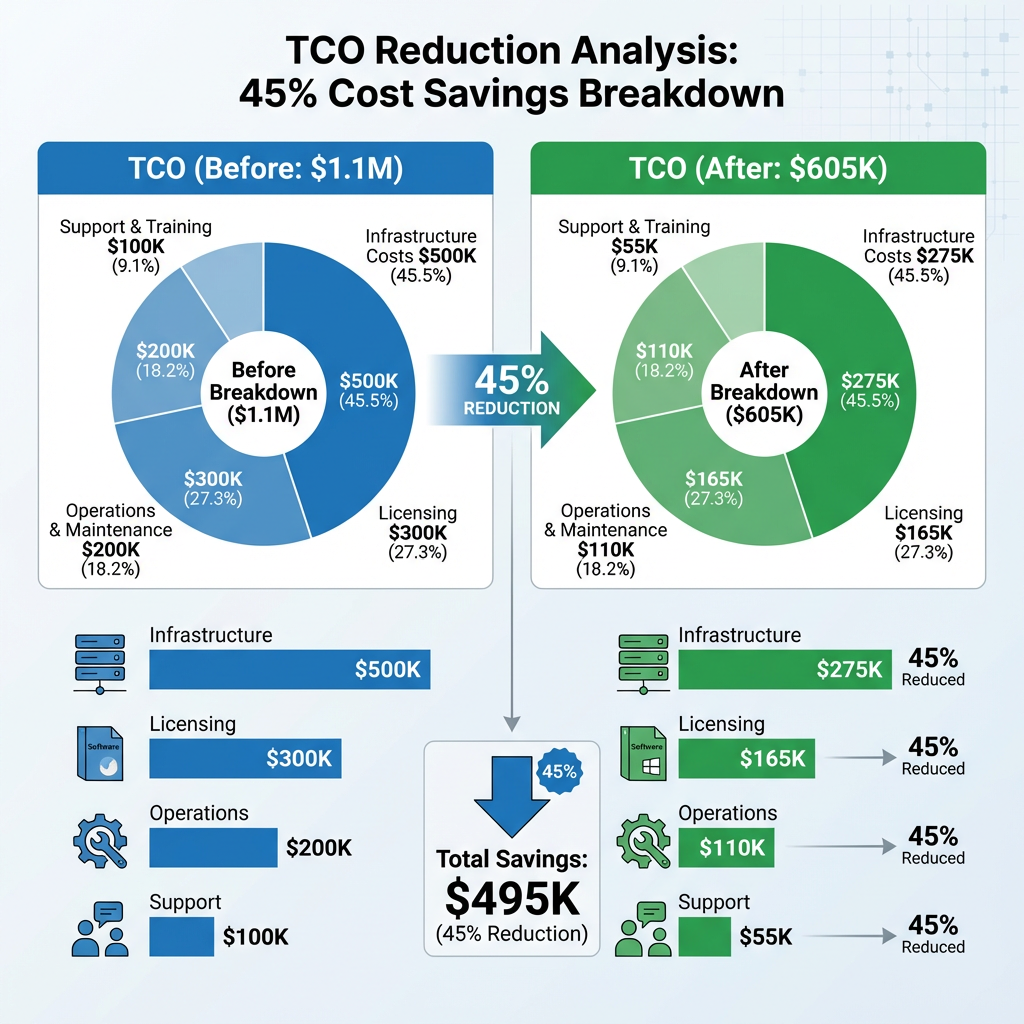
Our performance optimization initiative delivered substantial cost reductions across multiple categories, demonstrating that strategic performance improvements directly translate to financial benefits.
Infrastructure Cost Reductions
Hardware Optimization: Performance improvements reduced hardware requirements:
- Server Consolidation: Eliminated 3 redundant servers through improved efficiency
- Memory Optimization: Reduced memory requirements by 40% through better utilization
- Storage Savings: Decreased storage needs through data compression and archiving
Cloud Cost Management: For cloud deployments, optimized resource allocation:
- Compute Instance Rightsizing: Matched instance types to actual performance requirements
- Auto-scaling Implementation: Dynamic resource allocation based on demand patterns
- Reserved Instance Utilization: Strategic capacity planning for predictable workloads
Operational Efficiency Gains
Reduced Maintenance Overhead: Performance stability decreased operational requirements:
- Automated Monitoring: Implemented proactive alerting reducing manual intervention by 60%
- Self-Healing Capabilities: Automated resolution of common performance issues
- Streamlined Troubleshooting: Standardized procedures reducing resolution time by 70%
Support Cost Optimization: Improved system reliability reduced support requirements:
- Incident Reduction: 80% decrease in performance-related support tickets
- Knowledge Transfer: Internal team capability building reduced external consultant dependency
- Preventive Maintenance: Proactive optimization preventing costly emergency interventions
Licensing and Compliance Benefits
Optimized Licensing: Performance improvements enabled license optimization:
- User License Efficiency: Increased user productivity reducing per-user licensing costs
- Module Consolidation: Eliminated redundant functionality through performance optimization
- Compliance Automation: Reduced manual compliance efforts through automated reporting
Implementation Best Practices
Establishing Performance Baselines
Comprehensive Baseline Measurement: Before implementing optimizations, establish detailed performance baselines:
- System Performance Metrics: Document current CPU, memory, and I/O utilization patterns
- Application Response Times: Measure end-to-end transaction performance
- User Experience Indicators: Capture user satisfaction and productivity metrics
- Cost Baseline: Document current operational and infrastructure costs
Phased Implementation Approach
Risk Mitigation Strategy: Implement optimizations in controlled phases:
Phase 1 – Quick Wins: Address obvious performance bottlenecks with minimal risk
- Parameter tuning and configuration optimization
- Index creation for frequently accessed tables
- Query hint implementation for problematic statements
Phase 2 – Systematic Optimization: Implement comprehensive performance improvements
- Memory management optimization
- SQL statement rewriting and optimization
- System architecture enhancements
Phase 3 – Advanced Features: Deploy sophisticated optimization techniques
- Plan stability implementation
- Advanced monitoring and alerting
- Automated performance management
Change Management and Monitoring
Continuous Monitoring: Implement robust monitoring to track optimization effectiveness:
- Real-time Performance Dashboards: Provide visibility into system performance trends
- Automated Alerting: Proactive notification of performance degradation
- Regular Performance Reviews: Scheduled assessments of optimization effectiveness
- User Feedback Integration: Incorporate end-user experience into performance metrics
Troubleshooting Common Performance Issues
System Hanging and High CPU Usage
Diagnostic Approach: When systems become unresponsive:
- Immediate Actions: Collect runtime dumps and system information before restarting
- Root Cause Analysis: Examine transparent huge page settings, OS page cache configuration
- Resolution Strategies: Apply appropriate system-level configurations and monitoring
Memory-Related Performance Problems
Out-of-Memory Situations: Address memory pressure proactively:
- Memory Tracking: Enable detailed memory consumption monitoring
- Statement Limits: Implement appropriate memory limits for SQL statements
- Garbage Collection: Optimize MVCC version management and cleanup processes
SQL Performance Optimization
Statement-Level Troubleshooting: Address slow-performing queries systematically:
- Plan Analysis: Use explain plans and plan visualizer for optimization insights
- Cache Management: Optimize plan cache utilization and statement reuse
- Engine Selection: Leverage appropriate execution engines for different query types
Future-Proofing Your SAP HANA Environment
Emerging Technologies and Trends
Machine Learning Integration: Leverage HANA’s built-in ML capabilities for predictive performance management:
- Predictive Analytics: Forecast performance trends and capacity requirements
- Anomaly Detection: Automatically identify unusual performance patterns
- Intelligent Optimization: ML-driven query optimization and resource allocation
Cloud-Native Optimization: Prepare for cloud migration and hybrid deployments:
- Container Orchestration: Optimize HANA for Kubernetes environments
- Multi-Cloud Strategy: Design for portability across cloud providers
- Edge Computing: Extend HANA capabilities to edge locations
Continuous Improvement Framework
Performance Excellence Culture: Establish organizational practices for ongoing optimization:
- Regular Performance Reviews: Scheduled assessments and optimization planning
- Knowledge Sharing: Cross-team collaboration and best practice documentation
- Training and Development: Continuous skill building for technical teams
- Innovation Integration: Adoption of new SAP features and capabilities
Conclusion: Transforming SAP HANA Performance and TCO
Our comprehensive approach to SAP HANA performance troubleshooting demonstrates that systematic optimization can deliver exceptional results. The 45% TCO reduction achieved through our methodology proves that performance improvements directly translate to significant cost savings while enhancing user experience and system reliability.
Key Success Factors
Systematic Methodology: Following a structured approach to performance analysis and optimization ensures comprehensive coverage of potential issues and opportunities.
Tool Integration: Leveraging SAP HANA’s built-in monitoring and analysis tools provides deep insights into system behavior and performance characteristics.
Continuous Monitoring: Implementing robust monitoring and alerting enables proactive performance management and rapid issue resolution.
Organizational Commitment: Success requires dedicated resources, executive support, and a culture of continuous improvement.
Recommendations for Implementation
Organizations embarking on similar optimization initiatives should:
- Start with Assessment: Conduct comprehensive baseline measurements and identify optimization opportunities
- Prioritize Quick Wins: Address obvious performance bottlenecks first to demonstrate value
- Invest in Training: Develop internal expertise in SAP HANA performance optimization
- Plan for Scale: Design optimization strategies that accommodate future growth and requirements
- Measure and Iterate: Continuously monitor results and refine optimization approaches
The journey to optimal SAP HANA performance requires dedication, expertise, and systematic execution. However, the rewards—both in terms of system performance and cost reduction—justify the investment and effort required. By following the methodologies and best practices outlined in this guide, organizations can achieve similar transformational results in their SAP HANA environments.
Ready to transform your SAP HANA performance? Contact our experts to discuss how these proven methodologies can be applied to your specific environment and requirements.