TiDB Performance Troubleshooting: A Systematic Guide to Diagnosing Slow Queries, Hot Regions, and TiKV Bottlenecks
TiDB’s distributed architecture offers exceptional scalability and high availability, but with complexity comes unique performance challenges. Whether you’re dealing with sluggish queries, uneven load distribution, or TiKV bottlenecks, systematic troubleshooting is essential for maintaining optimal database performance. This comprehensive guide provides a structured approach to diagnosing and resolving the most common TiDB performance issues.
Understanding TiDB’s Performance Landscape
TiDB’s distributed nature means performance issues can manifest across multiple components: the TiDB server layer for SQL processing, TiKV for distributed storage, and PD for cluster management. Unlike traditional databases, performance bottlenecks in TiDB require understanding the interaction between these components and their respective roles in query execution.
The key to effective troubleshooting lies in recognizing that performance issues typically fall into three categories: optimizer-related problems, system-level bottlenecks, and resource contention issues. Each category requires different diagnostic approaches and resolution strategies.
Systematic Approach to Performance Troubleshooting
The Three-Step Methodology
Effective TiDB performance troubleshooting follows a systematic three-step approach:
- Identify the performance bottleneck – Determine which component and stage of query execution is consuming the most time
- Analyze system issues – Examine possible causes based on monitoring data and system logs
- Analyze optimizer issues – Evaluate whether better execution plans exist
This methodology ensures you address root causes rather than symptoms, leading to more effective and lasting solutions.
Essential Diagnostic Tools
Before diving into specific issues, familiarize yourself with TiDB’s diagnostic toolkit:
- TiDB Dashboard: Provides intuitive interfaces for slow query analysis and cluster monitoring
- Slow Query Log: Records comprehensive duration information for all SQL execution stages
- EXPLAIN ANALYZE: Offers detailed execution statistics for each query operator
- Grafana Monitoring: Displays real-time metrics for all cluster components
Diagnosing Slow Queries
Identification and Classification
The first step in addressing slow queries is systematic identification. TiDB Dashboard’s Slow Queries page automatically captures queries exceeding 300 milliseconds, though this threshold is configurable. Use the statement summary table feature to identify patterns among slow queries rather than focusing on individual instances.
Performance Bottleneck Analysis
Once you’ve identified slow queries, determine where the bottleneck occurs using the TiDB performance map as your guide. The slow log provides comprehensive timing information across all execution stages, while EXPLAIN ANALYZE offers granular operator-level statistics.
System issues in slow queries typically manifest in three ways:
- TiKV Processing Delays: Slow coprocessor operations or storage layer bottlenecks
- TiDB Execution Issues: Inefficient join operations or memory constraints
- Infrastructure Problems: Network latency, timestamp acquisition delays, or resource contention
Resolution Strategies
For TiKV-related slowdowns, examine coprocessor metrics and storage I/O patterns. TiDB execution issues often require query optimization, index tuning, or execution plan adjustments. Infrastructure problems typically need system-level interventions like network optimization or resource scaling.
Identifying and Resolving Hot Regions
Detection Methods
Hot regions represent one of TiDB’s most common performance challenges, occurring when certain data ranges receive disproportionate read or write traffic. Detection requires monitoring specific metrics:
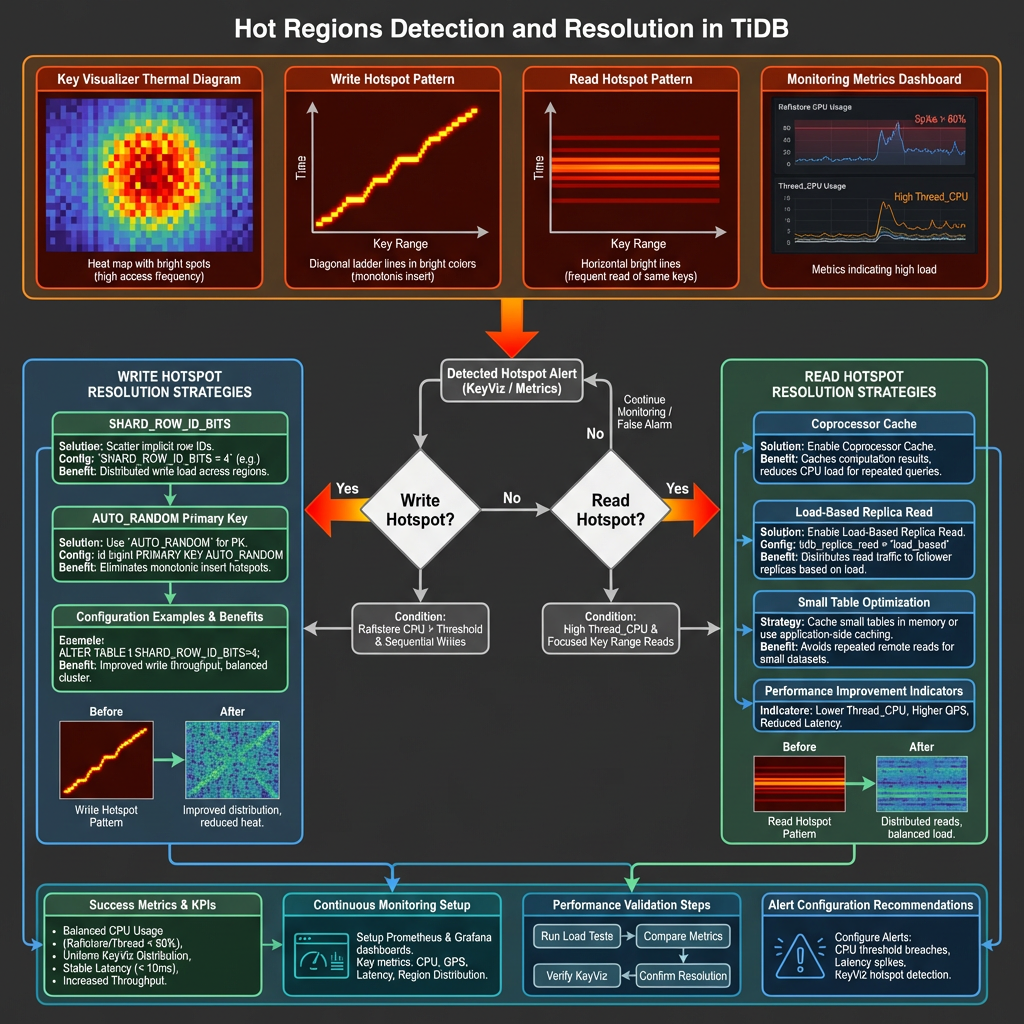
Write Hotspots: Monitor the Raftstore CPU metric in TiKV-Trouble-Shooting panels. Significantly higher values on specific TiKV nodes indicate write hotspots.
Read Hotspots: Examine Thread_CPU metrics in TiKV-Details panels, particularly coprocessor CPU values that exceed normal thresholds.
Visual Analysis with Key Visualizer
TiDB Dashboard’s Key Visualizer provides thermal diagrams that make hotspot identification intuitive. The horizontal axis represents time, while the vertical axis shows tables and indexes. Brighter colors indicate higher load concentrations.
Write hotspots typically appear as bright diagonal lines forming ladder patterns, indicating sequential data insertion. Read hotspots manifest as bright horizontal lines, common with small tables experiencing high access volumes.
Resolution Techniques
SHARD_ROW_ID_BITS for Write Hotspots: This feature scatters RowIDs across multiple regions, effectively distributing write load for tables using implicit auto-increment RowIDs. Configure using ALTER TABLE … SHARD_ROW_ID_BITS = <value> where the value determines the number of shards.
AUTO_RANDOM for Primary Key Hotspots: Replace auto-increment primary keys with AUTO_RANDOM to generate randomly distributed, unique keys that eliminate sequential write patterns.
Coprocessor Cache for Read Hotspots: Enable this feature to cache computing results for small tables experiencing read hotspots, significantly reducing repeated computation overhead.
Load-Based Replica Read: Available in TiDB v7.1.0+, this feature automatically distributes read requests to follower replicas when leader nodes become overloaded.
TiKV Bottleneck Analysis
Understanding TiKV Thread Architecture
TiKV’s performance depends on several thread pools, each serving specific functions:
- gRPC threads: Handle client requests and inter-node communication
- Raftstore threads: Manage Raft consensus and log replication
- Apply threads: Process committed Raft entries
- Scheduler threads: Coordinate transaction scheduling
- UnifyReadPool: Handle read operations
- RocksDB threads: Manage storage engine operations
Critical Metrics and Thresholds
Raftstore CPU Utilization: Should remain below 80% of raftstore.store-pool-sizeunder normal conditions. Since TiDB v3.0, Raftstore supports multi-threading, significantly reducing single-thread bottlenecks.
gRPC Thread Performance: Monitor gRPC CPU per thread metrics to identify communication bottlenecks. High values may indicate network issues or excessive request volumes.
Apply Thread Efficiency: Async apply CPU metrics exceeding 80% suggest bottlenecks in processing committed Raft entries.
Bottleneck Resolution
For Raftstore bottlenecks, consider increasing raftstore.store-pool-size to improve concurrency. Enable Hibernate Region feature to reduce unnecessary Region heartbeats when dealing with massive Region counts.
gRPC bottlenecks often require scaling TiKV instances or optimizing network configuration. Apply thread issues may benefit from tuning RocksDB compaction settings or adjusting write batch sizes.
Monitoring and Tools Setup
Comprehensive Monitoring Architecture
Deploy Grafana and Prometheus alongside your TiDB cluster using TiUP for automated monitoring setup. The Performance Overview dashboard provides orchestrated metrics across TiDB, PD, and TiKV components.
Key Monitoring Practices
Establish baseline metrics for normal operations, focusing on:
- Query response times and throughput patterns
- Resource utilization across all components
- Region distribution and hotspot indicators
- Network and storage I/O patterns
Configure alerting thresholds based on your specific workload characteristics rather than generic recommendations.
Proactive Monitoring Strategies
Implement monitoring that identifies issues before they impact users:
- Trend Analysis: Track performance degradation over time
- Capacity Planning: Monitor resource growth patterns
- Anomaly Detection: Identify unusual patterns in query execution or resource usage
Best Practices and Prevention
Configuration Optimization
Optimize TiDB configuration for your specific workload patterns. Write-intensive workloads benefit from adjusted compaction parameters and flow control settings, while read-heavy applications may require different cache and connection pool configurations.
Query Design Guidelines
Design queries with TiDB’s distributed nature in mind:
- Avoid operations that require cross-region data movement
- Use appropriate indexes to minimize full table scans
- Consider data locality when designing table schemas
- Implement proper connection pooling and prepared statements
Preventive Measures
Schema Design: Choose appropriate primary key strategies to prevent hotspots from the outset. Consider using UUID or hash-based keys for high-write scenarios.
Capacity Planning: Monitor growth trends and scale proactively rather than reactively. TiDB’s horizontal scaling capabilities work best when implemented before bottlenecks occur.
Regular Maintenance: Implement routine performance reviews, including query plan analysis and resource utilization assessment.
Advanced Troubleshooting Techniques
Multi-Component Analysis
Complex performance issues often span multiple components. Use correlation analysis between TiDB, TiKV, and PD metrics to identify cascading effects. For example, PD scheduling issues can manifest as TiKV performance problems.
Workload Characterization
Understand your application’s access patterns:
- Temporal Patterns: Identify peak usage periods and seasonal variations
- Data Access Patterns: Analyze which tables and indexes receive the most traffic
- Query Complexity: Categorize queries by complexity and resource requirements
Performance Testing
Implement systematic performance testing:
- Baseline Establishment: Document performance under known conditions
- Regression Testing: Verify that changes don’t introduce performance degradation
- Stress Testing: Understand system behavior under extreme conditions
Conclusion
Effective TiDB performance troubleshooting requires a systematic approach that considers the distributed nature of the system. By following the methodologies outlined in this guide—from systematic bottleneck identification to proactive monitoring—you can maintain optimal database performance even as your system scales.
Remember that performance optimization is an iterative process. Regular monitoring, proactive maintenance, and continuous learning about your specific workload patterns are essential for long-term success. The tools and techniques described here provide a foundation, but the most effective troubleshooting comes from understanding your unique environment and application requirements.
Success in TiDB performance management comes from combining systematic diagnostic approaches with deep understanding of distributed database principles. By mastering these skills, you’ll be equipped to handle performance challenges at any scale, ensuring your TiDB deployment continues to meet your application’s demanding requirements.