SQL Server 2025 Wait Statistics: A Comprehensive Guide to Performance Monitoring and Optimization
SQL Server 2025 represents a significant leap forward in database performance monitoring and optimization, with enhanced wait statistics capabilities that provide unprecedented visibility into system bottlenecks and performance issues. Wait statistics serve as SQL Server’s internal health indicators, helping database administrators and developers identify precisely where the database engine is spending time—whether on I/O operations, locks, memory allocation, or CPU processing.
Understanding and effectively utilizing wait statistics is crucial for maintaining optimal database performance in SQL Server 2025. With over 1,300 different wait types available in modern SQL Server versions, mastering the most critical ones enables DBAs to move from guesswork to precise performance tuning. This comprehensive guide explores the enhanced wait statistics features in SQL Server 2025, providing practical insights for performance optimization and troubleshooting.
Understanding Wait Statistics Fundamentals
What Are Wait Statistics?
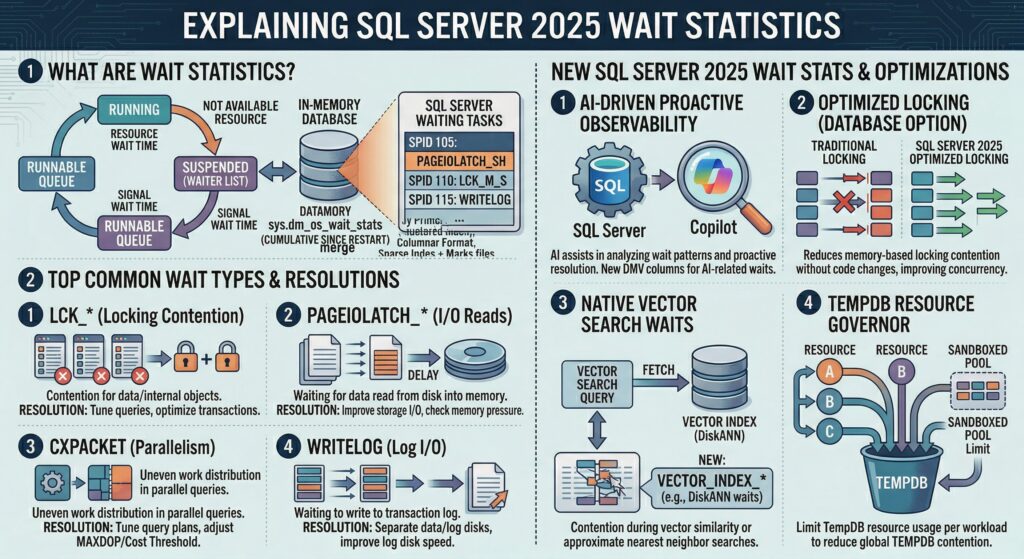
Wait statistics in SQL Server represent the time that threads spend waiting for resources to become available. When a SQL Server process cannot immediately access a required resource—such as a data page, lock, or CPU time—it enters a wait state. These waits are categorized and tracked by SQL Server, providing valuable diagnostic information about system performance bottlenecks.
The wait statistics model in SQL Server follows a simple but powerful concept: every time a task needs to wait for a resource, the wait type, duration, and frequency are recorded. This data accumulates over time, creating a comprehensive picture of where the database engine encounters delays and resource contention.
The Three Components of Wait Statistics
SQL Server wait statistics consist of three key metrics:
- Wait Time: The total time spent waiting for a specific resource type
- Wait Count: The number of times a particular wait type occurred
- Signal Wait Time: The time spent waiting for CPU after the resource became available
These metrics work together to provide a complete picture of performance bottlenecks. High wait times indicate resource contention, while high wait counts suggest frequent resource conflicts. Signal wait time helps identify CPU pressure scenarios where tasks wait for processor time even after their required resources become available.
Key Wait Types and Their Meanings
CXPACKET and CXCONSUMER Waits
CXPACKET waits are among the most commonly encountered wait types in SQL Server environments, particularly those with multiple CPU cores. These waits occur during parallel query execution when worker threads are waiting to synchronize with each other. SQL Server 2017 CU3 introduced the CXCONSUMER wait type to provide better granularity in parallelism analysis.
CXPACKET waits typically indicate:
- Parallel query execution inefficiencies
- Imbalanced workload distribution across threads
- Suboptimal MAXDOP (Maximum Degree of Parallelism) settings
- Cost threshold for parallelism configuration issues
PAGEIOLATCH Wait Types
PAGEIOLATCH waits represent one of the most critical performance indicators in SQL Server, signaling delays in reading data pages from storage into memory. These waits occur when SQL Server needs to read pages from disk that are not currently in the buffer pool.
Common PAGEIOLATCH scenarios include:
- Insufficient memory allocation causing frequent disk reads
- Slow storage subsystem performance
- Large table scans without proper indexing
- Memory pressure from other processes
PAGEIOLATCH_SH (shared) waits are particularly common and often indicate the need for better indexing strategies or increased memory allocation.
LCK% Wait Types
Lock-related waits (LCK_M_S, LCK_M_X, LCK_M_U, etc.) indicate contention for database resources where multiple processes are attempting to access the same data simultaneously. These waits can significantly impact application performance and user experience.
SOS_SCHEDULER_YIELD
This wait type occurs when a task voluntarily yields the CPU to allow other tasks to execute. While some level of SOS_SCHEDULER_YIELD waits is normal in busy systems, excessive waits may indicate CPU pressure or inefficient query execution.
New Features and Improvements in SQL Server 2025
Enhanced Performance Monitoring
SQL Server 2025 introduces significant performance improvements that directly impact wait statistics analysis. The new version focuses on smarter query execution, improved CPU scheduling, and reduced locking mechanisms, which collectively reduce common wait types and improve overall system responsiveness.
Key improvements include:
- Optimized CPU Scheduling: Enhanced thread management reduces SOS_SCHEDULER_YIELD waits
- Reduced Locking Overhead: Improved locking mechanisms minimize lock-related wait types
- Better Memory Management: Enhanced buffer pool management reduces PAGEIOLATCH waits
Query Store Enhancements
SQL Server 2025 builds upon the Query Store functionality introduced in earlier versions, providing enhanced wait statistics tracking per query. The Query Store now offers more granular wait statistics analysis, allowing DBAs to identify specific queries contributing to particular wait types.
The enhanced Query Store features include:
- Per-query wait statistics tracking
- Historical wait pattern analysis
- Improved correlation between query plans and wait types
- Better visualization tools for wait statistics analysis
Intelligent Query Processing Improvements
SQL Server 2025 refines Intelligent Query Processing (IQP) capabilities, which directly impact wait statistics by optimizing query execution plans and reducing resource contention. These improvements help minimize various wait types through better cardinality estimation and adaptive query processing.
Dynamic Management Views (DMVs) for Wait Statistics
sys.dm_os_wait_stats
The primary DMV for retrieving wait statistics is sys.dm_os_wait_stats, which provides aggregated wait information across the entire SQL Server instance. This view contains cumulative data since the last server restart or statistics reset.
SELECT
    wait_type,
    waiting_tasks_count,
    wait_time_ms,
    max_wait_time_ms,
    signal_wait_time_ms
FROM sys.dm_os_wait_stats
WHERE wait_type NOT LIKE '%SLEEP%'
ORDER BY wait_time_ms DESC;
sys.dm_exec_session_wait_stats
For session-specific wait analysis, sys.dm_exec_session_wait_stats provides wait statistics broken down by individual sessions. This DMV is particularly useful for identifying problematic connections or applications.
sys.dm_os_waiting_tasks
The sys.dm_os_waiting_tasks DMV shows currently waiting tasks in real-time, providing immediate insight into active bottlenecks. This view is invaluable for troubleshooting ongoing performance issues.
sys.query_store_wait_stats
SQL Server 2025 enhances the Query Store with improved wait statistics tracking through sys.query_store_wait_stats. This view enables correlation between specific queries and their associated wait patterns over time.
Best Practices for Wait Statistics Analysis
Establishing Baselines
Effective wait statistics analysis begins with establishing performance baselines during normal operating conditions. Regular monitoring and documentation of typical wait patterns enable quick identification of anomalies and performance degradation.
Key baseline metrics include:
- Top 10 wait types by total wait time
- Average wait times for critical wait types
- Wait count patterns during peak and off-peak hours
- Correlation between wait types and business processes
Filtering Irrelevant Waits
Not all wait types indicate performance problems. Many waits are normal parts of SQL Server operation and should be filtered out during analysis. Common waits to exclude include:
- SLEEP waits (WAITFOR, BROKER_RECEIVE_WAITFOR)
- Background task waits (CHECKPOINT_QUEUE, LAZYWRITER_SLEEP)
- Service Broker waits (unless actively using Service Broker)
Prioritizing Wait Types
Focus analysis on wait types that represent the highest percentage of total wait time rather than those with the highest wait counts. A small number of long waits often has more performance impact than many short waits.
Using Wait Statistics for Capacity Planning
Wait statistics provide valuable insights for capacity planning and hardware optimization. Consistent PAGEIOLATCH waits may indicate the need for faster storage or additional memory, while persistent CXPACKET waits might suggest CPU or parallelism configuration adjustments.
Troubleshooting Common Wait Types
Resolving CXPACKET Waits
CXPACKET wait optimization involves several configuration adjustments:
- Adjust Cost Threshold for Parallelism: Increase from the default value of 5 to 25-50 for most workloads
- Configure MAXDOP: Set to the number of physical cores per NUMA node, typically 4-8
- Review Query Design: Optimize queries to reduce parallel execution requirements
- Consider Hardware: Ensure balanced CPU and memory resources
Addressing PAGEIOLATCH Issues
PAGEIOLATCH wait resolution strategies include:
- Memory Optimization: Increase SQL Server memory allocation to reduce disk I/O
- Storage Performance: Upgrade to faster storage subsystems (SSD, NVMe)
- Index Optimization: Create appropriate indexes to reduce table scan operations
- Query Tuning: Optimize queries to minimize data page access
Managing Lock Waits
Lock-related wait resolution involves:
- Transaction Optimization: Minimize transaction duration and scope
- Isolation Level Adjustment: Use appropriate isolation levels for workload requirements
- Index Strategy: Implement proper indexing to reduce lock escalation
- Application Design: Modify application logic to reduce lock contention
Performance Optimization Strategies
Proactive Monitoring
Implement automated monitoring solutions that track wait statistics trends and alert on significant deviations from baseline performance. SQL Server 2025’s enhanced monitoring capabilities provide better integration with existing monitoring tools.
Query Store Integration
Leverage SQL Server 2025’s improved Query Store functionality to correlate wait statistics with specific queries and execution plans. This integration enables targeted optimization efforts and more effective performance tuning.
Regular Maintenance
Establish regular maintenance routines that include:
- Wait statistics analysis and trending
- Index maintenance and optimization
- Statistics updates for query plan accuracy
- Configuration review and adjustment
Performance Testing
Implement comprehensive performance testing that includes wait statistics analysis before deploying changes to production environments. This approach helps identify potential performance regressions before they impact users.
Advanced Wait Statistics Analysis
Temporal Analysis
Analyze wait statistics patterns over time to identify trends and correlate performance issues with business activities, batch processes, or system changes. SQL Server 2025’s enhanced historical tracking capabilities support more sophisticated temporal analysis.
Cross-Correlation Analysis
Examine relationships between different wait types to understand complex performance scenarios. For example, high PAGEIOLATCH waits combined with RESOURCE_SEMAPHORE waits might indicate memory pressure affecting I/O performance.
Workload Characterization
Use wait statistics to characterize different workload types and optimize system configuration for specific usage patterns. OLTP workloads typically show different wait patterns compared to analytical or reporting workloads.
Monitoring Tools and Automation
Built-in Tools
SQL Server 2025 includes enhanced built-in monitoring capabilities through SQL Server Management Studio (SSMS) and the Query Store interface. These tools provide graphical representations of wait statistics and simplified analysis workflows.
Third-Party Solutions
Consider implementing specialized monitoring tools that provide advanced wait statistics analysis, alerting, and historical trending capabilities. Many tools integrate with SQL Server’s DMVs to provide comprehensive performance monitoring solutions.
Custom Monitoring Scripts
Develop custom monitoring scripts that capture and analyze wait statistics according to specific organizational requirements. These scripts can be automated to provide regular reports and proactive alerting.
Future Considerations and Trends
AI-Driven Performance Optimization
SQL Server 2025’s focus on AI integration suggests future developments in automated performance optimization based on wait statistics analysis. Machine learning algorithms may eventually provide predictive performance tuning recommendations.
Cloud Integration
As organizations increasingly adopt hybrid and cloud deployments, wait statistics analysis must adapt to distributed environments and cloud-specific performance characteristics.
Continuous Performance Optimization
The trend toward continuous integration and deployment requires real-time performance monitoring and automated optimization based on wait statistics feedback.
Conclusion
SQL Server 2025’s enhanced wait statistics capabilities provide database administrators and developers with powerful tools for performance monitoring, troubleshooting, and optimization. Understanding wait statistics fundamentals, leveraging new features, and implementing best practices enables organizations to maintain optimal database performance and user experience.
The key to successful wait statistics utilization lies in establishing baselines, focusing on the most impactful wait types, and implementing systematic approaches to performance optimization. SQL Server 2025’s improvements in CPU scheduling, locking mechanisms, and Query Store functionality provide a solid foundation for effective performance management.
As database workloads continue to evolve and grow in complexity, wait statistics analysis remains one of the most valuable techniques for maintaining high-performance SQL Server environments. By mastering these concepts and tools, database professionals can ensure their SQL Server 2025 implementations deliver optimal performance and reliability for critical business applications.
Regular monitoring, proactive analysis, and continuous optimization based on wait statistics insights will help organizations maximize their investment in SQL Server 2025 while providing exceptional database performance for users and applications.