Profiling and Optimizing Long-Running Queries in CockroachDB
CockroachDB is a distributed SQL database designed for scalability, resilience, and consistency across geographically dispersed environments. As workloads grow in complexity and data volume increases, query performance becomes a critical factor in maintaining application responsiveness and user satisfaction. One of the most common performance challenges in any database system is the presence of long-running queries that consume excessive resources, block other operations, or degrade overall cluster performance.
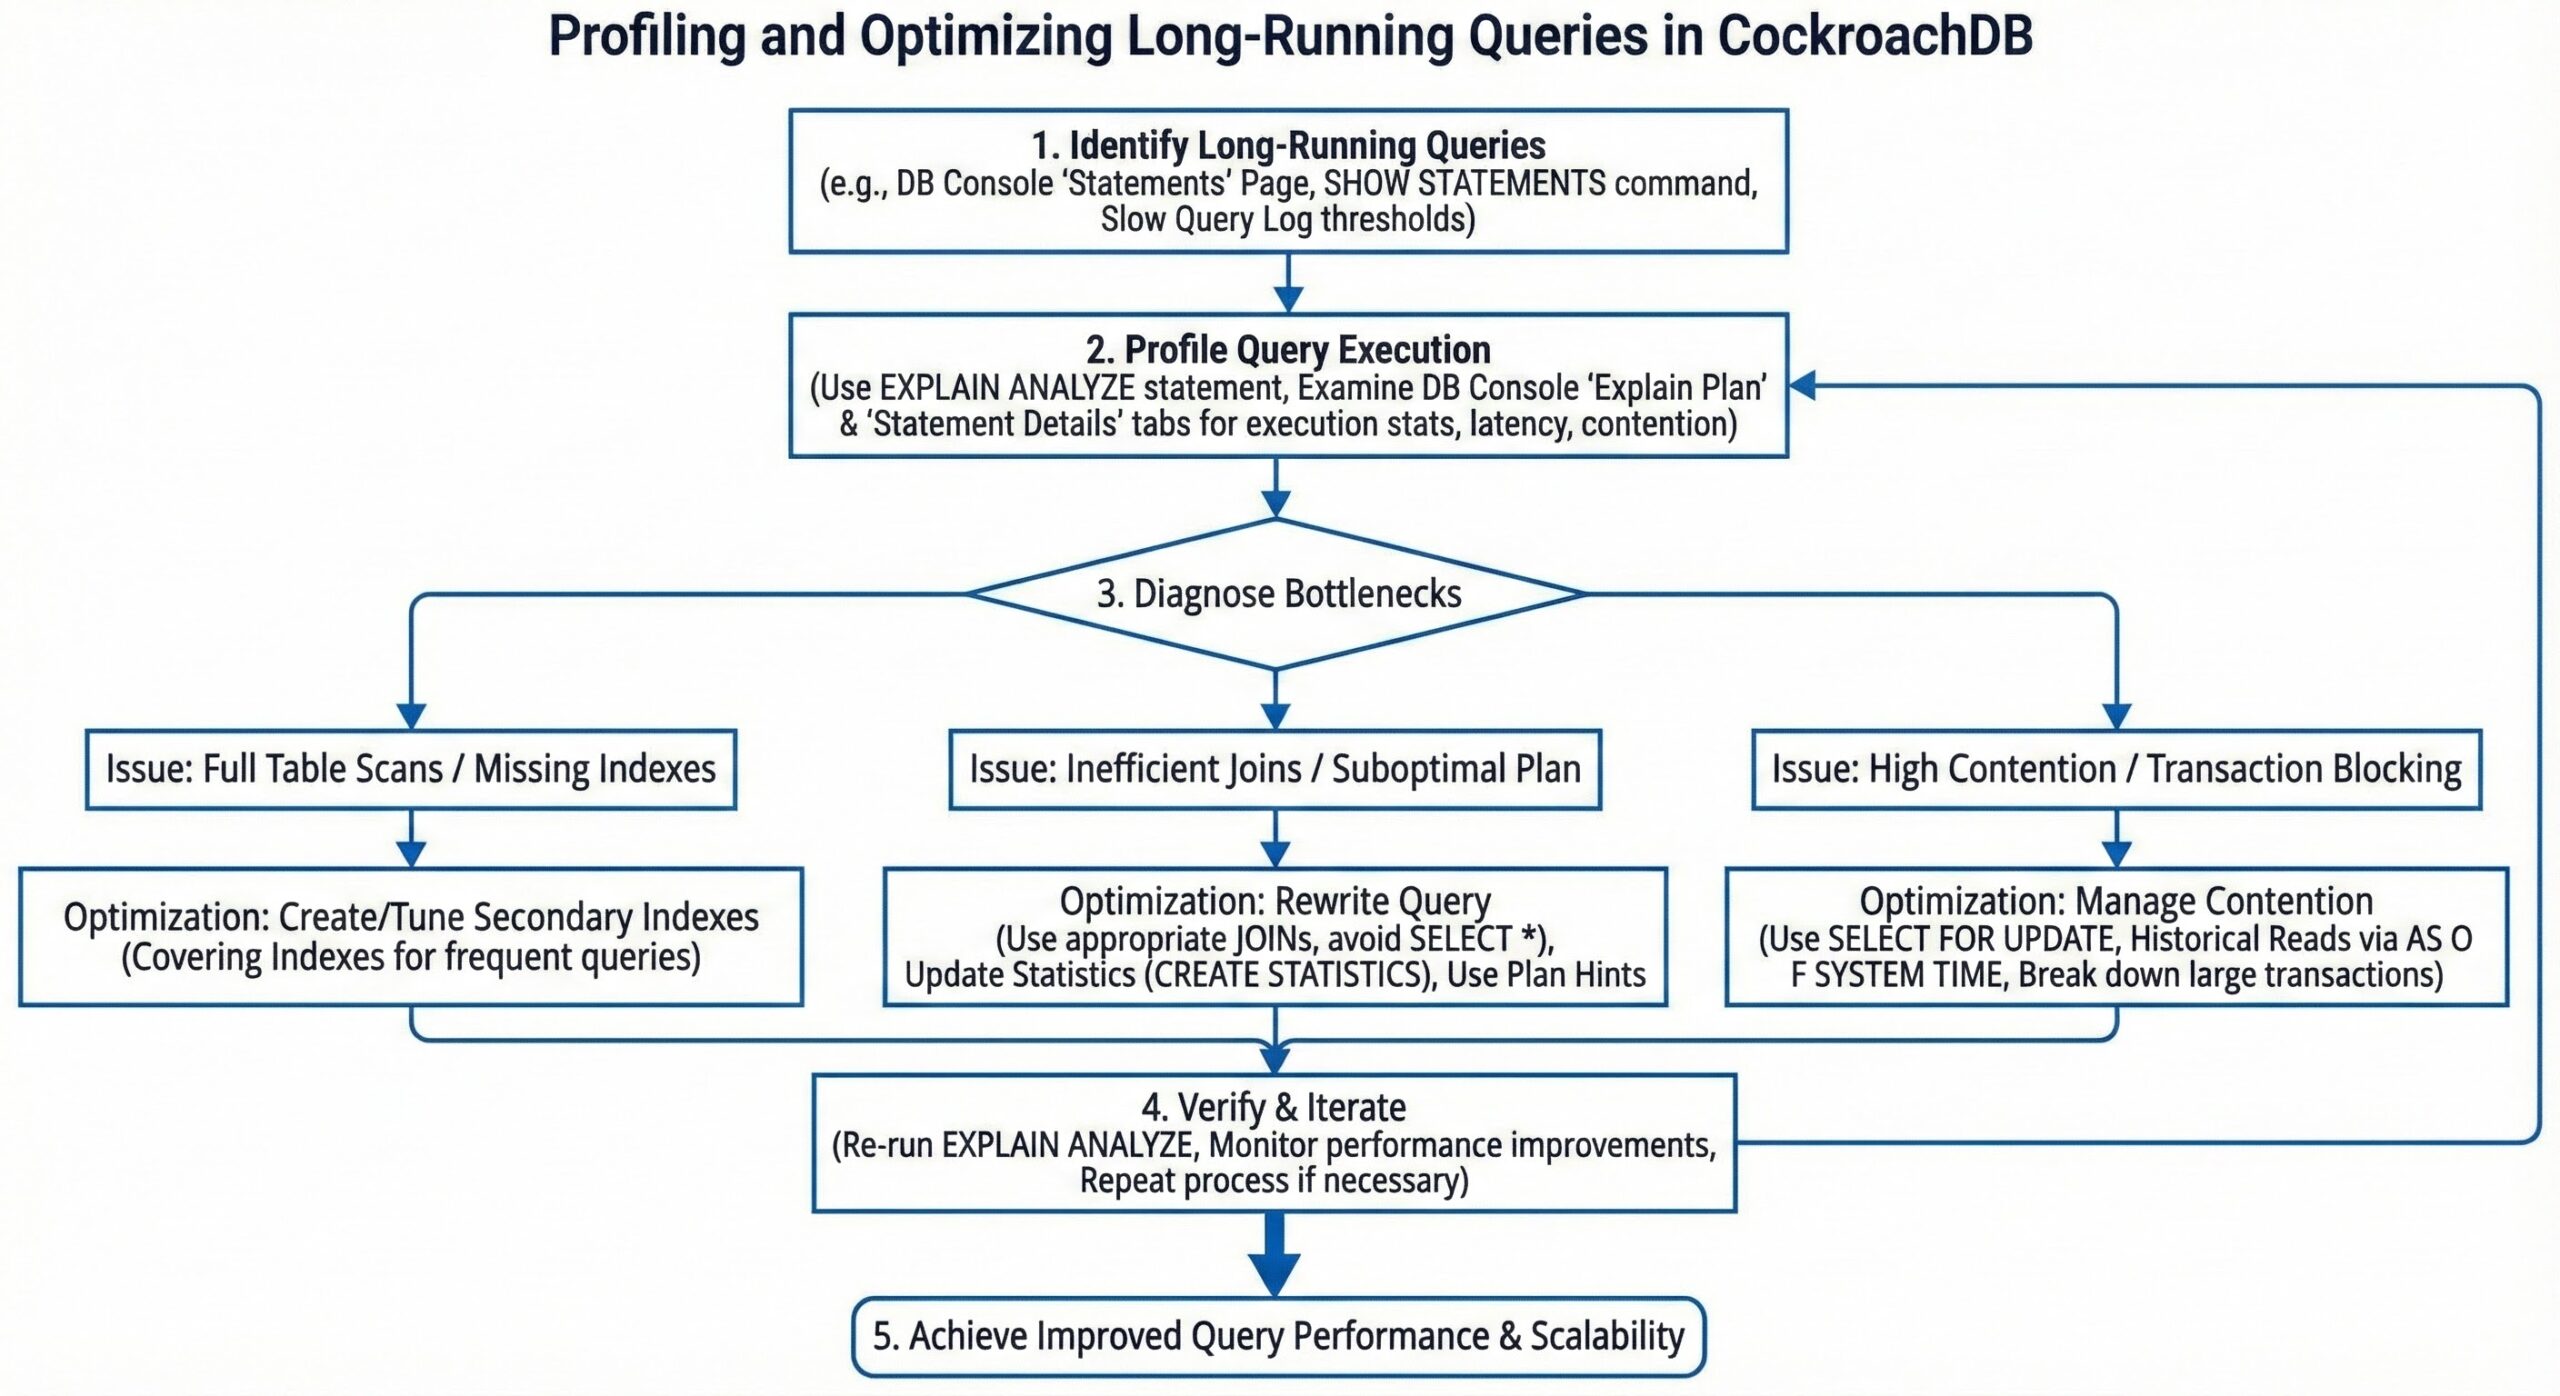
To address this, CockroachDB provides a robust suite of tools for profiling long-running queries. These include system statements, the built-in DB Console (specifically the Statements and Insights pages), slow query logging, and detailed plan analysis using EXPLAIN and TRACE. Together, these mechanisms enable developers and database administrators to identify problematic queries, understand their root causes—such as inefficient execution plans, contention, retries, or resource bottlenecks—and iteratively optimize them for better performance .
Identifying Long-Running Queries
The first step in performance tuning is detection: knowing which queries are running longer than expected. CockroachDB offers multiple avenues to surface long-running SQL statements.
One of the most direct methods is using the SHOW [CLUSTER] STATEMENTS command. This statement returns information about currently executing SQL queries, including the query text, application name, start time, and execution phase. By wrapping this in a Common Table Expression (CTE) and filtering on start < now() – interval ‘N minutes’, you can isolate queries that have been running beyond a specified threshold—say, more than five minutes—making it easier to spot potential issues in real time .
For example:
WITH long_running AS (
  SHOW CLUSTER STATEMENTS
)
SELECT * FROM long_running
WHERE start < now() - interval '5 minutes';
This query retrieves all active statements that have been executing for over five minutes, allowing immediate intervention if necessary.
In addition to real-time visibility, CockroachDB’s DB Console provides historical and aggregated insights into query behavior. The Statements page displays metrics such as average latency, maximum latency, and retry counts over time, enabling you to identify high-latency query fingerprints even when they are not currently running . The Insightspage takes this further by automatically surfacing queries flagged for poor performance, such as those with high contention or frequent retries . These views are invaluable for proactive monitoring and long-term performance analysis.
Canceling Problematic Queries and Isolating Impact
Once a long-running query has been identified, especially one that may be degrading cluster performance, it’s often necessary to terminate it. Using the query_id obtained from SHOW STATEMENTS, you can issue a CANCEL QUERY ‘<query_id>’ command to stop the query mid-execution . This capability is crucial for protecting cluster stability during production incidents or runaway queries caused by bugs or missing indexes .
However, cancellation should be used judiciously, particularly in transactional systems where partial rollbacks can affect application state. In many cases, a better approach is to prevent such conflicts in the first place.
For analytical workloads that require scanning large datasets, CockroachDB supports the AS OF SYSTEM TIME clause. This allows queries to read data as of a past timestamp, effectively performing historical reads that do not conflict with ongoing OLTP transactions . By decoupling analytics from real-time traffic, you reduce lock contention and ensure that long-running reports or batch jobs don’t interfere with foreground operations—a best practice for mixed workload environments .
Leveraging the Slow Query Log for Continuous Profiling
While real-time monitoring helps catch immediate issues, continuous profiling requires persistent logging. CockroachDB includes a dedicated slow query log that automatically captures SQL statements exceeding a configurable latency threshold .
You can enable and configure this log using cluster settings. For instance:
SET CLUSTER SETTING sql.log.slow_query.latency_threshold = '100ms';
This setting ensures that any query taking longer than 100 milliseconds is logged with detailed timing information, including parse time, planning time, and execution duration . These logs are written to the server’s log files and can be ingested into external monitoring or SIEM systems for offline analysis, alerting, and trend tracking .
The slow query log is particularly useful for identifying recurring performance issues that may not always trigger immediate alerts but accumulate over time. It also integrates well with log aggregation pipelines, making it a key component of observability in production deployments .
Analyzing Query Execution Plans
Knowing that a query is slow is only half the battle; understanding why it’s slow is where deep diagnostics come in. CockroachDB provides two powerful tools for this: EXPLAIN and EXPLAIN ANALYZE.
The EXPLAIN statement shows the query execution plan without running the query, revealing how the optimizer intends to retrieve data—whether through full table scans, index scans, joins, or distributed execution steps . Look for red flags such as full table scans on large tables, which often indicate missing indexes, or high fan-out operations that distribute work across many nodes inefficiently .
For even deeper insight, EXPLAIN ANALYZE executes the query and overlays actual runtime statistics onto the plan, showing row counts, timing per node, and memory usage. This helps validate whether the optimizer’s estimates were accurate and identify stages where the query spends the most time .
When plan-level analysis isn’t enough, SHOW TRACE FOR SESSION provides a granular breakdown of latency across different phases of query execution . This trace includes detailed spans for network waits, lock contention, transaction retries, and disk I/O, allowing you to distinguish between CPU-bound processing and stalls due to concurrency issues . For example, if a query shows significant time in “lock wait” states, it suggests contention that could be mitigated through schema redesign, better indexing, or transaction batching.
Gaining Higher-Level Performance Insights
Beyond individual query analysis, CockroachDB’s DB Console offers higher-level views that classify query behavior by symptom categories such as Slow Execution, High Contention, High Retry Count, or Suboptimal Plan . These Insights and Query Behavior Troubleshooting views act as an integrated SQL profiler, correlating performance anomalies with actionable recommendations .
For instance, if a query repeatedly fails due to serialization conflicts, the system might recommend adjusting the transaction isolation level or rewriting the transaction logic to minimize conflicts. Similarly, if a query consistently performs full scans, the console may suggest creating a specific secondary index to accelerate lookups .
These automated insights significantly reduce the time required for root cause analysis, especially for teams without deep database expertise. They also help detect plan regressions—situations where an upgrade or schema change causes the optimizer to choose a less efficient plan—by comparing historical performance patterns .
Best Practices for Query Performance Optimization
To make the most of CockroachDB’s profiling capabilities, consider the following best practices:
- Set appropriate thresholds: Configure sql.log.slow_query.latency_threshold based on your application’s SLAs. A 100ms threshold may be suitable for OLTP systems, while analytical queries might warrant higher limits.
- Monitor regularly: Use the DB Console daily to review Insights and Statements pages, catching issues before they escalate.
- Use historical reads: For reporting and analytics, always prefer AS OF SYSTEM TIME to avoid interfering with live transactions .
- Index strategically: Create indexes based on query patterns, not guesswork. Let the Insights page guide index recommendations, then validate with EXPLAIN.
- Test changes safely: Before applying schema changes or index additions in production, test them in a staging environment using realistic workloads.
- Leverage automation: Integrate slow query logs with alerting systems (e.g., Prometheus + Alertmanager) to notify teams of performance degradation in real time.
Conclusion
Profiling long-running queries in CockroachDB is a multi-layered process that combines real-time monitoring, historical analysis, and deep diagnostic tools. From identifying active slow queries with SHOW STATEMENTS to canceling them safely, leveraging the slow query log for continuous insight, and drilling down into execution plans with EXPLAIN and TRACE, CockroachDB equips you with everything needed to maintain high-performance SQL workloads .
Moreover, the DB Console’s Insights and Query Behavior Troubleshooting features elevate the experience by providing automated, symptom-based diagnostics and tuning suggestions . Together, these tools transform query optimization from a reactive firefighting exercise into a proactive, data-driven discipline.
By adopting these practices and integrating them into your operational workflows, you can ensure that your CockroachDB clusters remain responsive, scalable, and resilient—even under demanding workloads . Whether you’re managing a small application or a global-scale platform, mastering these profiling techniques is essential for achieving optimal database performance.