Comprehensive Guide to Configuring PostgreSQL Logs for Troubleshooting Query Performance
Introduction
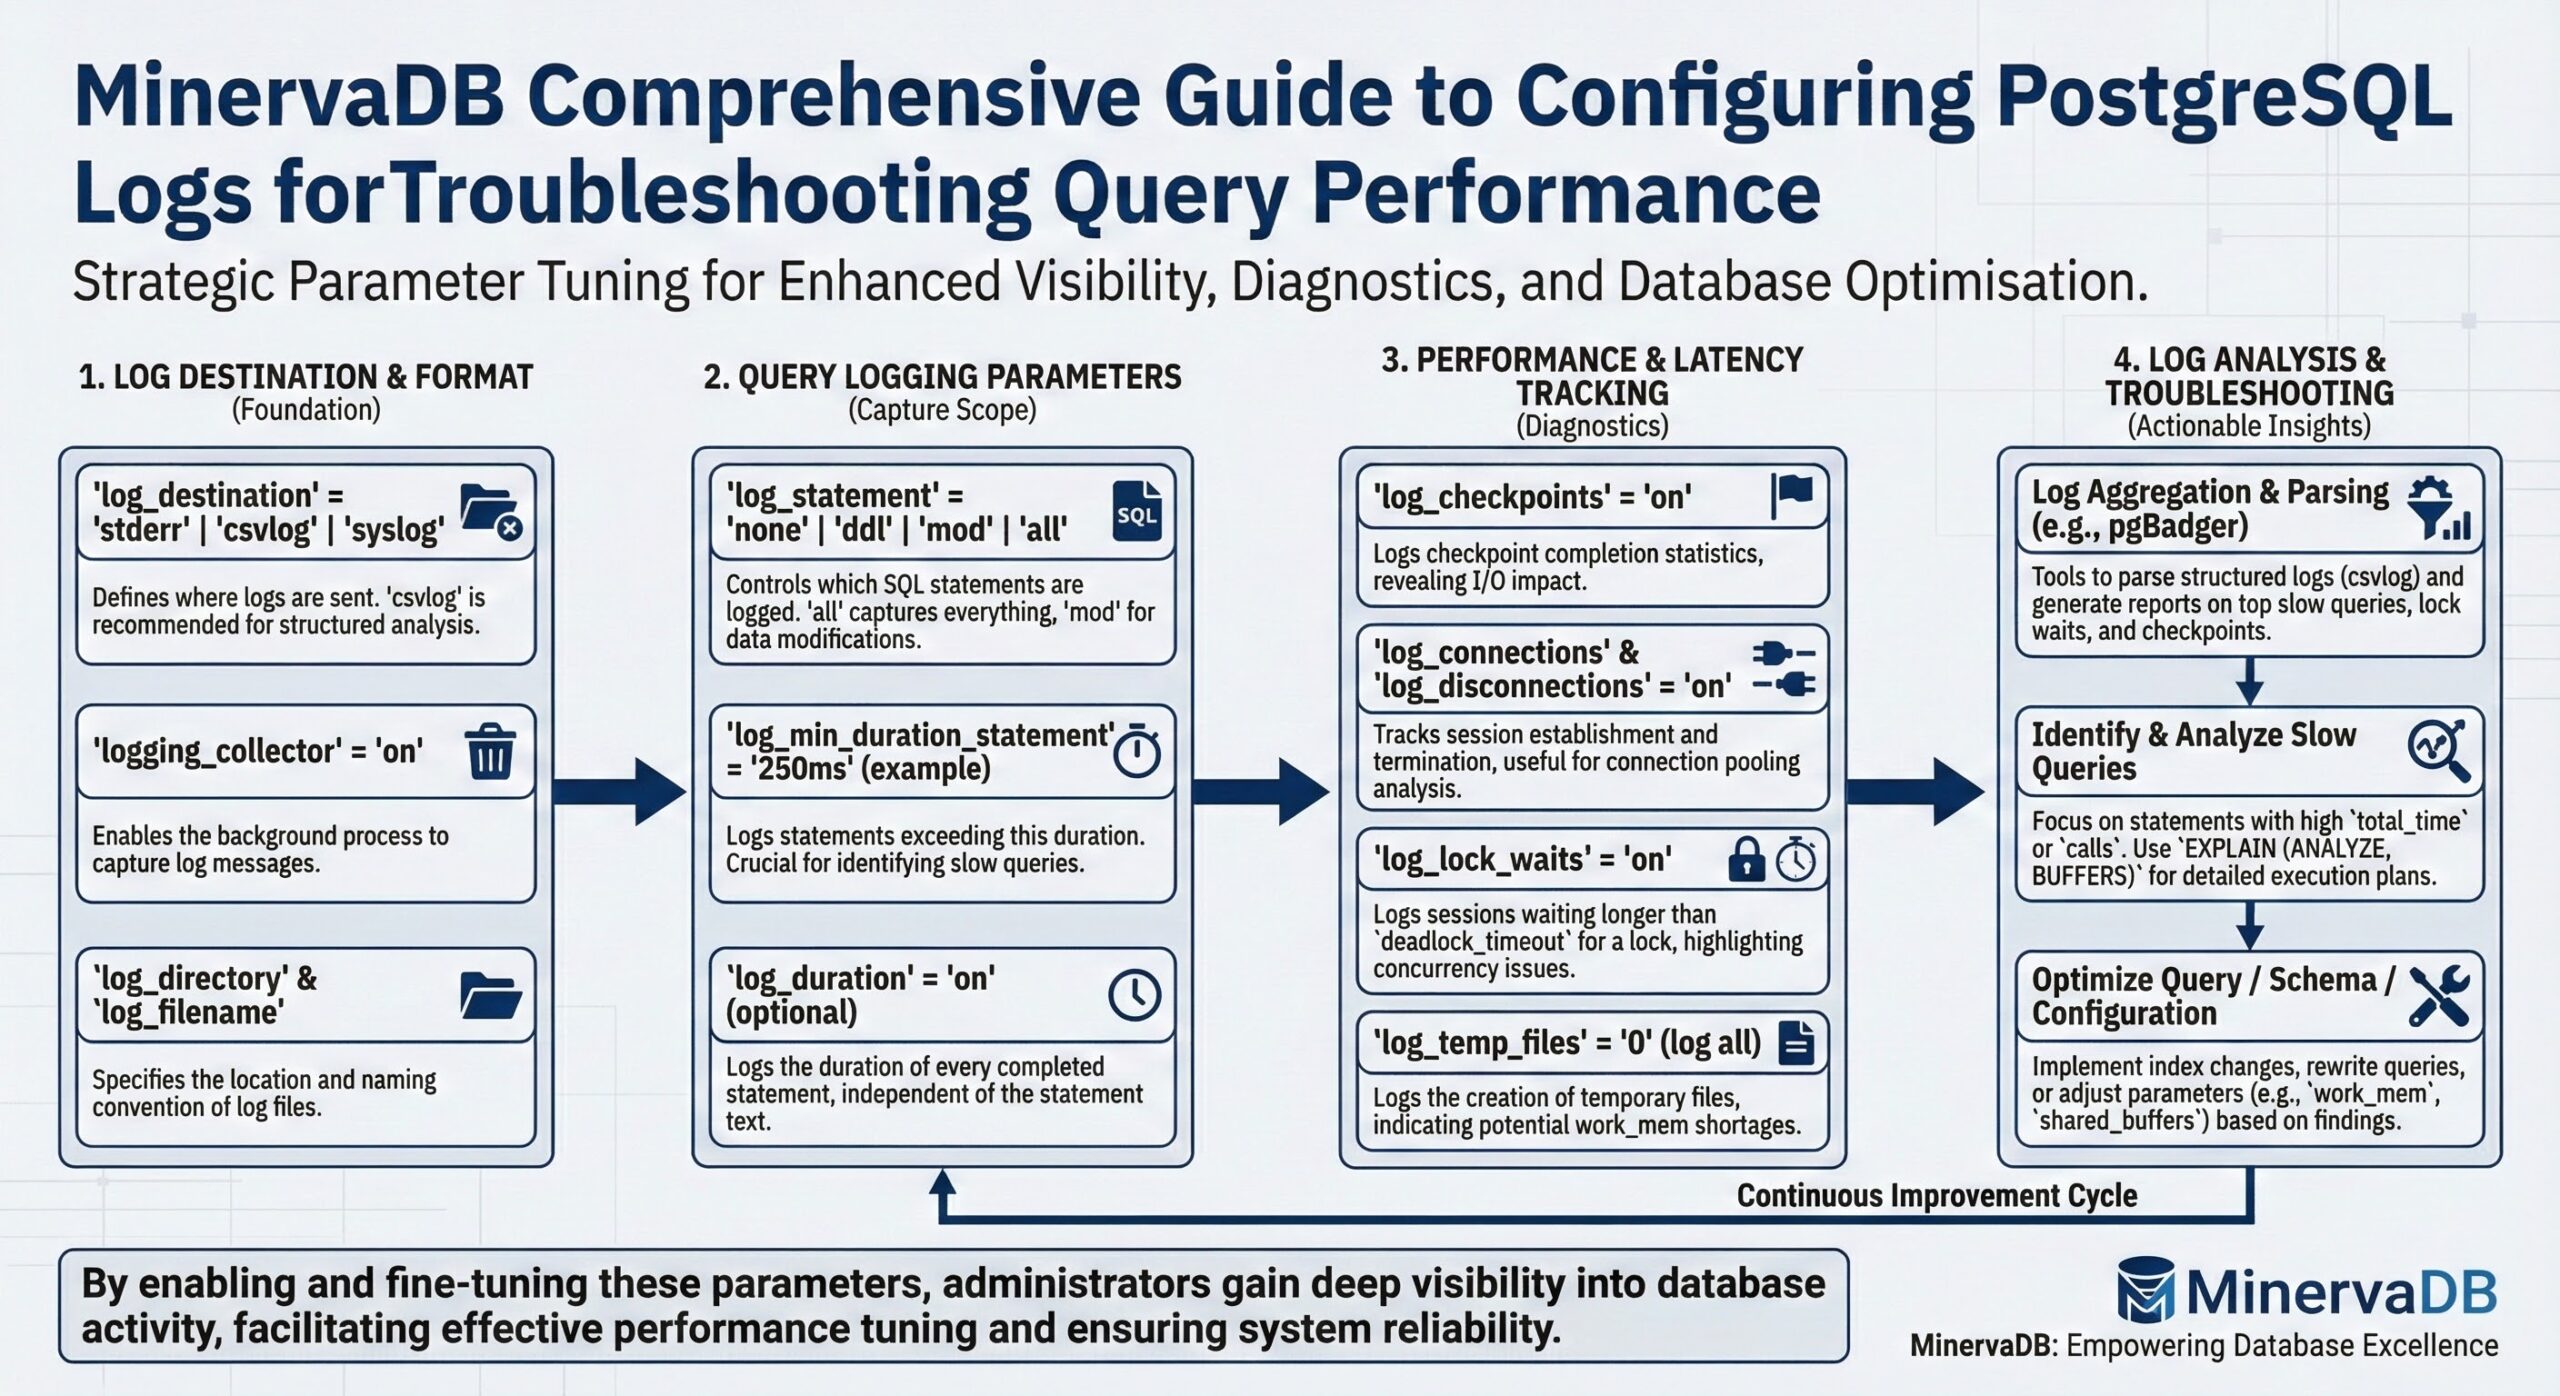
Configuring logging in PostgreSQL is crucial for troubleshooting query performance issues. Below is a guide on how to set up and tune PostgreSQL's logging configuration for optimal query performance troubleshooting.
Steps to Configure Log Operations in PostgreSQL
1. Modify postgresql.conf
Locate and edit the postgresql.conf file (usually in the PostgreSQL data directory). Adjust the following settings for effective logging:
Basic Logging Configuration
- Enable Logging
logging_collector = on
This ensures logs are written to files instead of just the standard output.
- Set Log Destination
log_destination = 'stderr' # or 'csvlog' for structured logs
Choose 'stderr' (default) or 'csvlog' for easier analysis with external tools.
- Log Directory and Filename
log_directory = 'pg_log'  # Directory for log files
log_filename = 'postgresql-%Y-%m-%d_%H%M%S.log'  # File naming convention
Detailed Query Logging
- Log All Queries
log_statement = 'all'
Logs all SQL statements. Useful for debugging but can generate large logs; use with caution in production.
- Log Only Slow Queries
log_min_duration_statement = 1000 # Log queries running longer than 1000ms (1 second)
This is ideal for identifying performance bottlenecks without overwhelming the log files.
- Include Parameterized Queries
log_statement_stats = on
Logs detailed statistics about query execution.
Log Connection and Disconnections
- Track Session Activity
log_connections = on
log_disconnections = on
Helps in identifying client connection patterns that may affect performance.
Log Lock and Deadlock Events
- Log Lock Waits
log_lock_waits = on
Logs queries waiting for locks for more than deadlock_timeout.
- Set Deadlock Timeout
deadlock_timeout = 1s
Defines the time PostgreSQL waits before logging a potential deadlock.
Log Autovacuum and Checkpoints
- Autovacuum Logs
log_autovacuum_min_duration = 1000 # Logs autovacuum tasks lasting more than 1 second
- Checkpoint Logs
log_checkpoints = on
Logs checkpoint activity, useful for troubleshooting write-heavy workloads.
2. Reload Configuration
After modifying postgresql.conf, reload PostgreSQL to apply the changes without restarting:
pg_ctl reload
# or for systemd-based systems
systemctl reload postgresql
3. Analyzing Logs
Use tools or scripts to analyze PostgreSQL logs:
CSV Logs
If csvlog is used, load logs into a table for analysis:
CREATE TABLE log_data (
    log_time TIMESTAMP,
    user_name TEXT,
    database_name TEXT,
    process_id INT,
    connection_from TEXT,
    session_id TEXT,
    session_line_num BIGINT,
    command_tag TEXT,
    session_start_time TIMESTAMP,
    virtual_transaction_id TEXT,
    transaction_id BIGINT,
    error_severity TEXT,
    sql_state_code TEXT,
    message TEXT,
    detail TEXT,
    hint TEXT,
    internal_query TEXT,
    internal_query_pos INT,
    context TEXT,
    query TEXT,
    query_pos INT,
    location TEXT,
    application_name TEXT
);
COPY log_data FROM '/path/to/csvlog' DELIMITER ',' CSV HEADER;
Third-Party Tools
Use tools like pgBadger to generate reports and visualize logs.
4. Monitor Query Performance
Use pg_stat_statements to complement logging:
CREATE EXTENSION IF NOT EXISTS pg_stat_statements;
SELECT query, calls, total_exec_time, rows
FROM pg_stat_statements
ORDER BY total_exec_time DESC;
Best Practices
- Avoid Overlogging: Too much logging can degrade performance. Use log_min_duration_statement for targeted troubleshooting.
- Rotate Logs: Use PostgreSQL's built-in log rotation settings:
log_rotation_age = 1d
log_rotation_size = 10MB
Alternatively, use external tools like logrotate.
- Secure Logs: Ensure logs do not expose sensitive information such as user credentials.
By enabling appropriate logging configurations and analyzing logs effectively, you can diagnose query performance issues and improve PostgreSQL performance. 🚀📜
Further Reading
Custom PostgreSQL Engineering Services
PostgreSQL Support with MinervaDB
Mitigating LWLock Contention in PostgreSQL
Deep Dive: High-Throughput Bulk Loading in PostgreSQL