Troubleshooting MongoDB with MongoDB Logs: A Complete Technical Guide
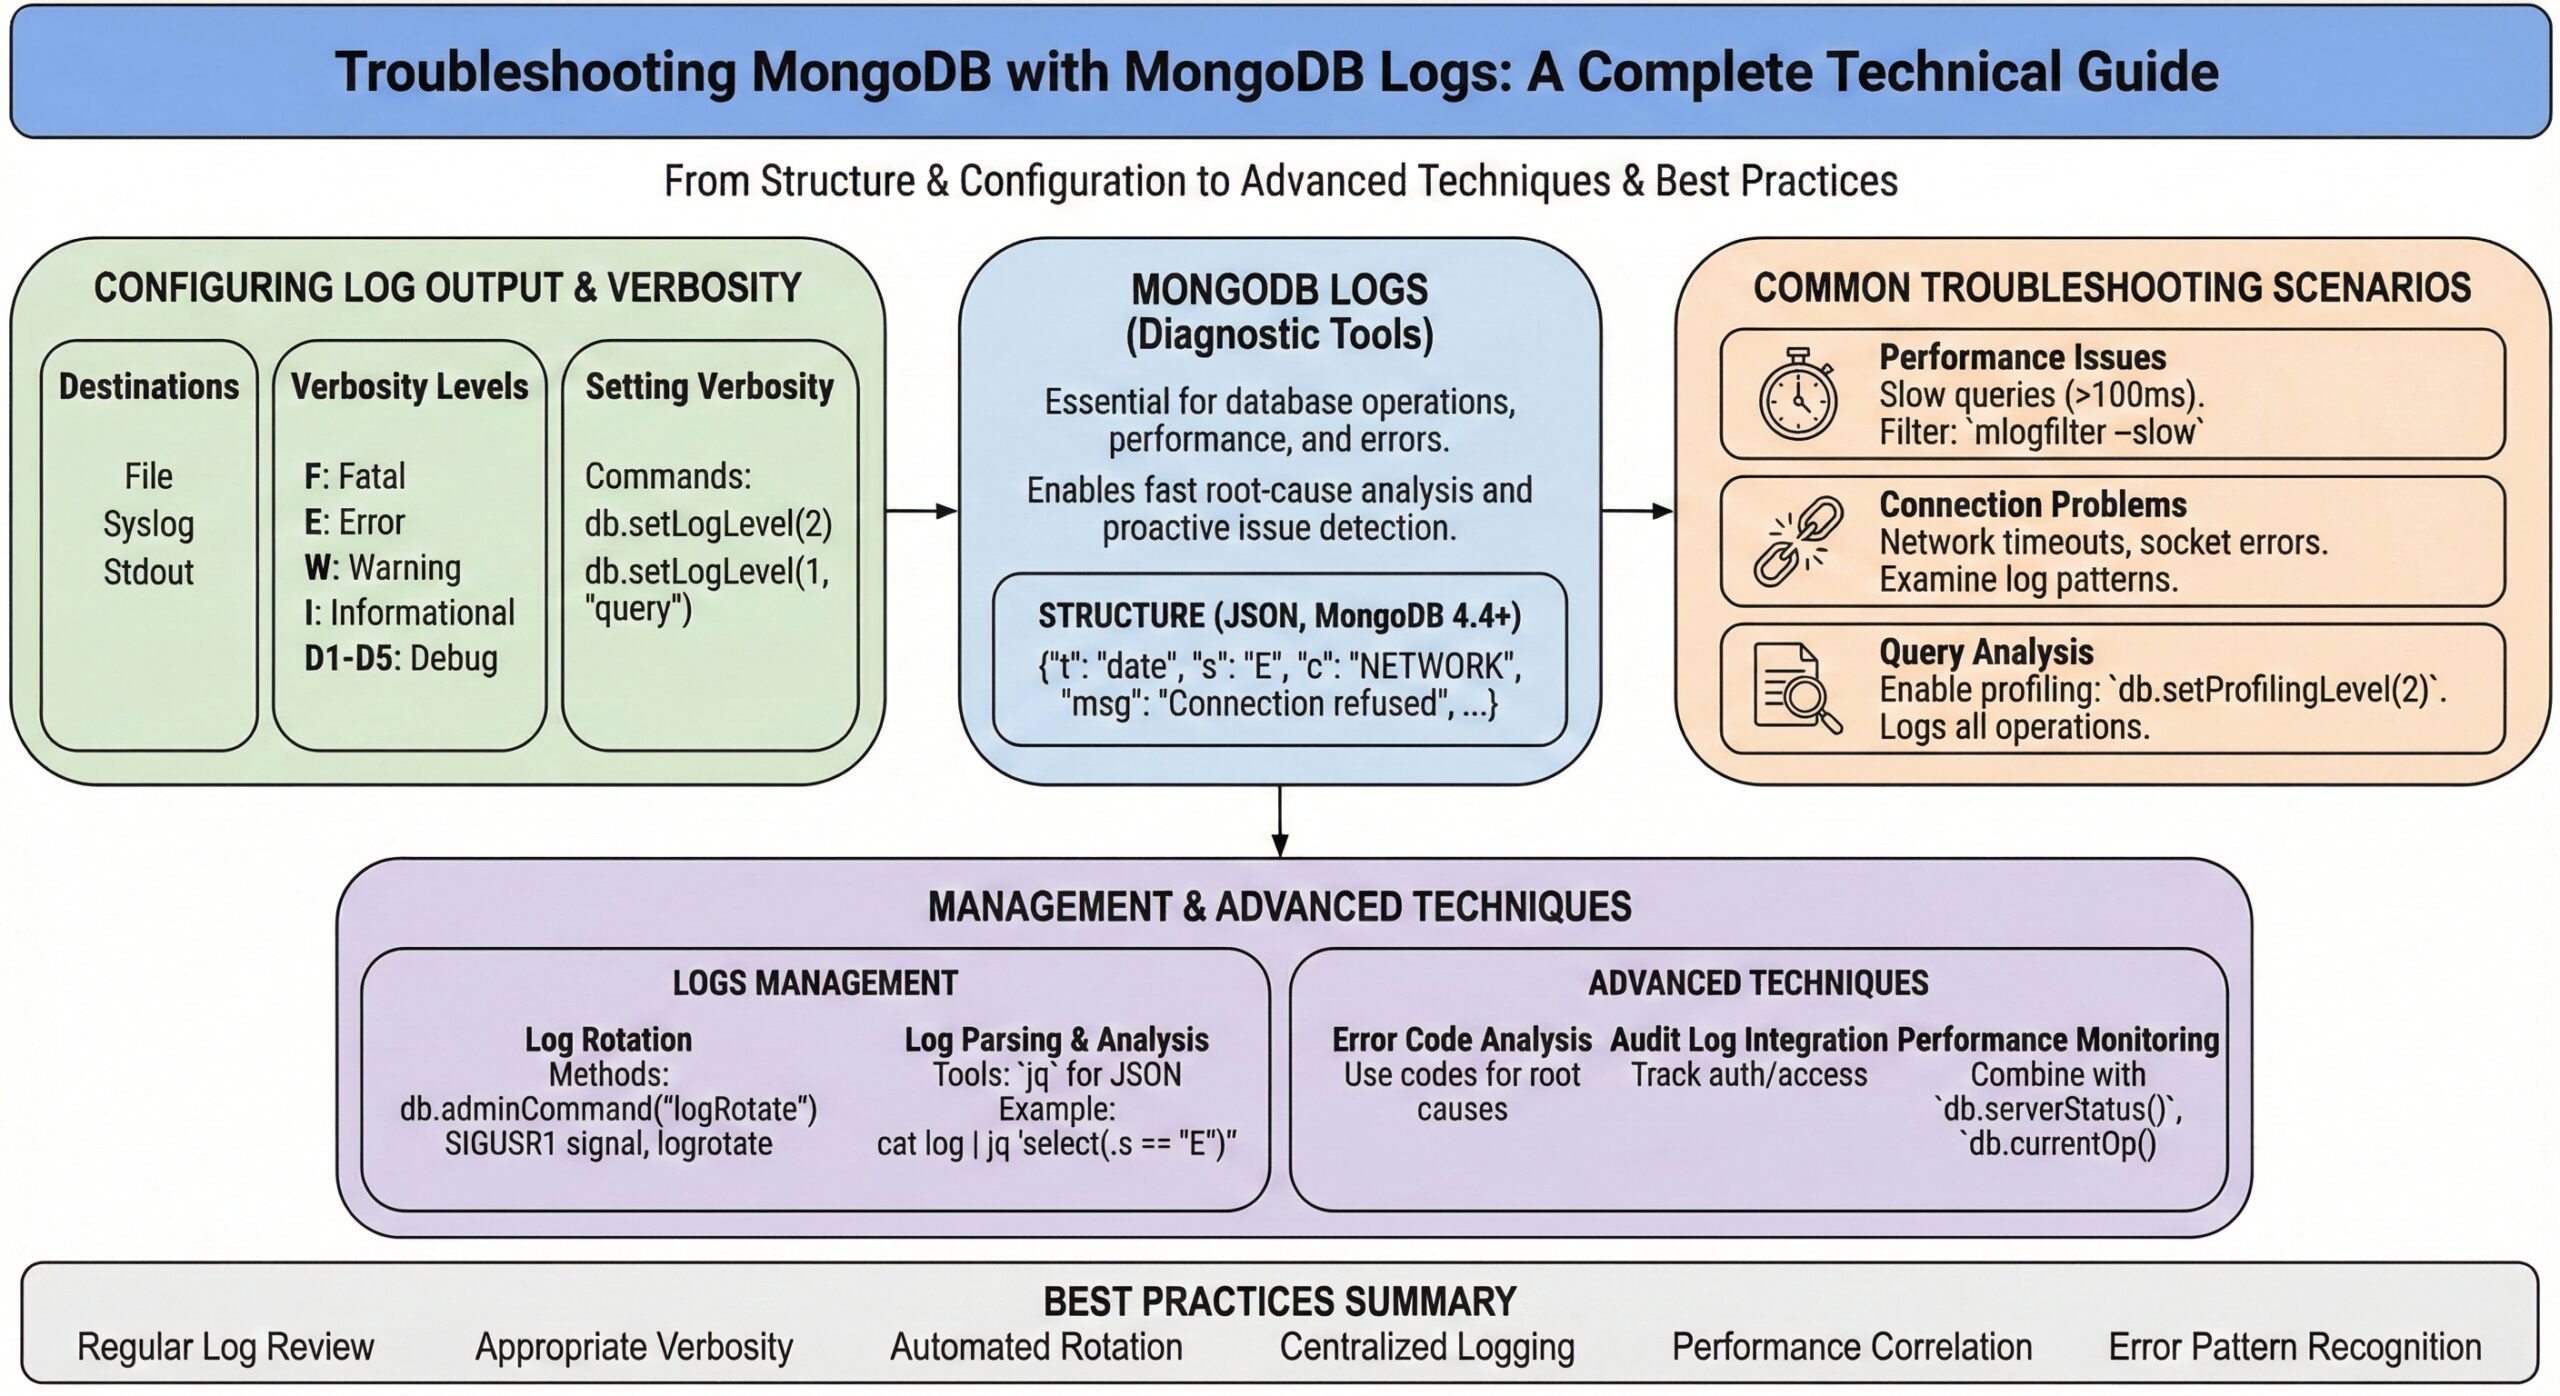
MongoDB logs are essential diagnostic tools that provide insights into database operations, performance issues, and errors. Understanding how to effectively analyse and troubleshoot using MongoDB logs can significantly improve your database performance and reliability. Troubleshooting MongoDB logs enables faster root-cause analysis, proactive issue detection, and more stable database operations.
Understanding MongoDB Log Structure
MongoDB maintains comprehensive logs of events, including incoming connections, executed commands, and encountered issues for diagnosing problems, monitoring deployments, and tuning performance1. Starting in MongoDB 4.4, all log messages are output in structured JSON format, where entries are written as key-value pairs indicating log message field types such as “severity” and their corresponding values.
Log Severity Levels
MongoDB uses a hierarchical severity system ranging from “Fatal” (most severe) to “Debug” (least severe)1:
- F (Fatal): Critical system failures
- E (Error): Error conditions requiring attention
- W (Warning): Warning messages about potential issues
- I (Informational): General operational information at verbosity level 0
- D1-D5 (Debug): Debug messages for verbosity levels 1-5
Configuring Log Output and Verbosity
Log Destinations
MongoDB log messages can be output to three destinations:
- File
- Syslog
- Stdout (standard output)
Setting Verbosity Levels
The default log verbosity level is 0, which includes all non-debug messages. You can adjust verbosity using:
// Set global verbosity level
db.setLogLevel(2)

// Set component-specific verbosity
db.setLogLevel(1, "query")
Verbosity levels 1-5 increase the amount of debug information included in logs.
Common Troubleshooting Scenarios
Performance Issues
MongoDB logs are instrumental in identifying performance bottlenecks. Slow queries (>100ms) are logged by default, making it easy to identify optimization opportunities.
# Filter slow operations using mlogfilter
mlogfilter --slow /var/log/mongodb/mongod.log
Connection Problems
When experiencing network timeouts or socket errors, examine the logs for connection-related messages. Look for patterns in connection establishment and termination.
Query Analysis
Enable profiling to log all operations:
// Enable profiling for all operations
db.setProfilingLevel(2)

// Or add to configuration file
--profile=2
This logs all operations, providing detailed query execution information.
MongoDB Logs Management Best Practices
Log Rotation
MongoDB supports several log rotation methods:
- Manual rotation using logRotate command:
db.adminCommand("logRotate")
- Automatic rotation with SIGUSR1 signal:
kill -SIGUSR1 <mongod_pid>
- Integration with system logrotate utility
Log Parsing and Analysis
For structured JSON logs, use tools like jq for parsing and filtering
# Pretty-print log entries
cat mongod.log | jq '.'

# Filter by severity level
cat mongod.log | jq 'select(.s == "E")'

# Extract slow operations
cat mongod.log | jq 'select(.attr.durationMillis > 100)'
Advanced Troubleshooting Techniques
Error Code Analysis
MongoDB returns specific error codes when issues occur. Use these codes to identify root causes and implement appropriate solutions.
Audit Log Integration
For security-related troubleshooting, enable audit logging to track authentication attempts, authorization failures, and data access patterns.
Performance Monitoring
Combine log analysis with performance metrics:
// Check server status for performance indicators
db.serverStatus()

// Monitor current operations
db.currentOp()
Configuration File Setup
Configure logging in your MongoDB configuration file:
systemLog:
  destination: file
  path: "/var/log/mongodb/mongod.log"
  logAppend: true
  verbosity: 1
Tools and Utilities
mtools Package
The mtools package provides powerful log analysis utilities:
- mlogfilter: Filter log entries by various criteria
- mloginfo: Extract summary information from logs
- mplotqueries: Visualize query patterns
Third-Party Solutions
Consider integrating with centralized logging solutions for distributed MongoDB deployments.
Best Practices Summary
- Regular Log Review: Establish routine log analysis procedures
- Appropriate Verbosity: Balance detail with log size management
- Automated Rotation: Implement log rotation to prevent disk space issues
- Centralized Logging: Use centralized logging for multi-instance deployments
- Performance Correlation: Combine log analysis with performance monitoring
- Error Pattern Recognition: Develop familiarity with common error patterns
Conclusion
Effective MongoDB logs troubleshooting requires understanding log structure, configuring appropriate verbosity levels, and using the right tools for analysis. By implementing these practices, you can proactively identify and resolve issues, optimize performance, and maintain reliable MongoDB deployments.
Regular log analysis, combined with proper configuration and monitoring tools, forms the foundation of successful MongoDB operations and troubleshooting strategies.
Further reading:
Optimizing Azure Database for MySQL
Securing User Accounts in PostgreSQL
Terminating Non-Responsive Redis Instances in a Redis Cluster
Principles and Metrics for MongoDB Capacity Planning and Sizing
Troubleshooting InnoDB Cluster Write Throughput and Latency
External References:
View, Retrieve, and Manage MongoDB Logs