Redis Performance Audit from MinervaDB
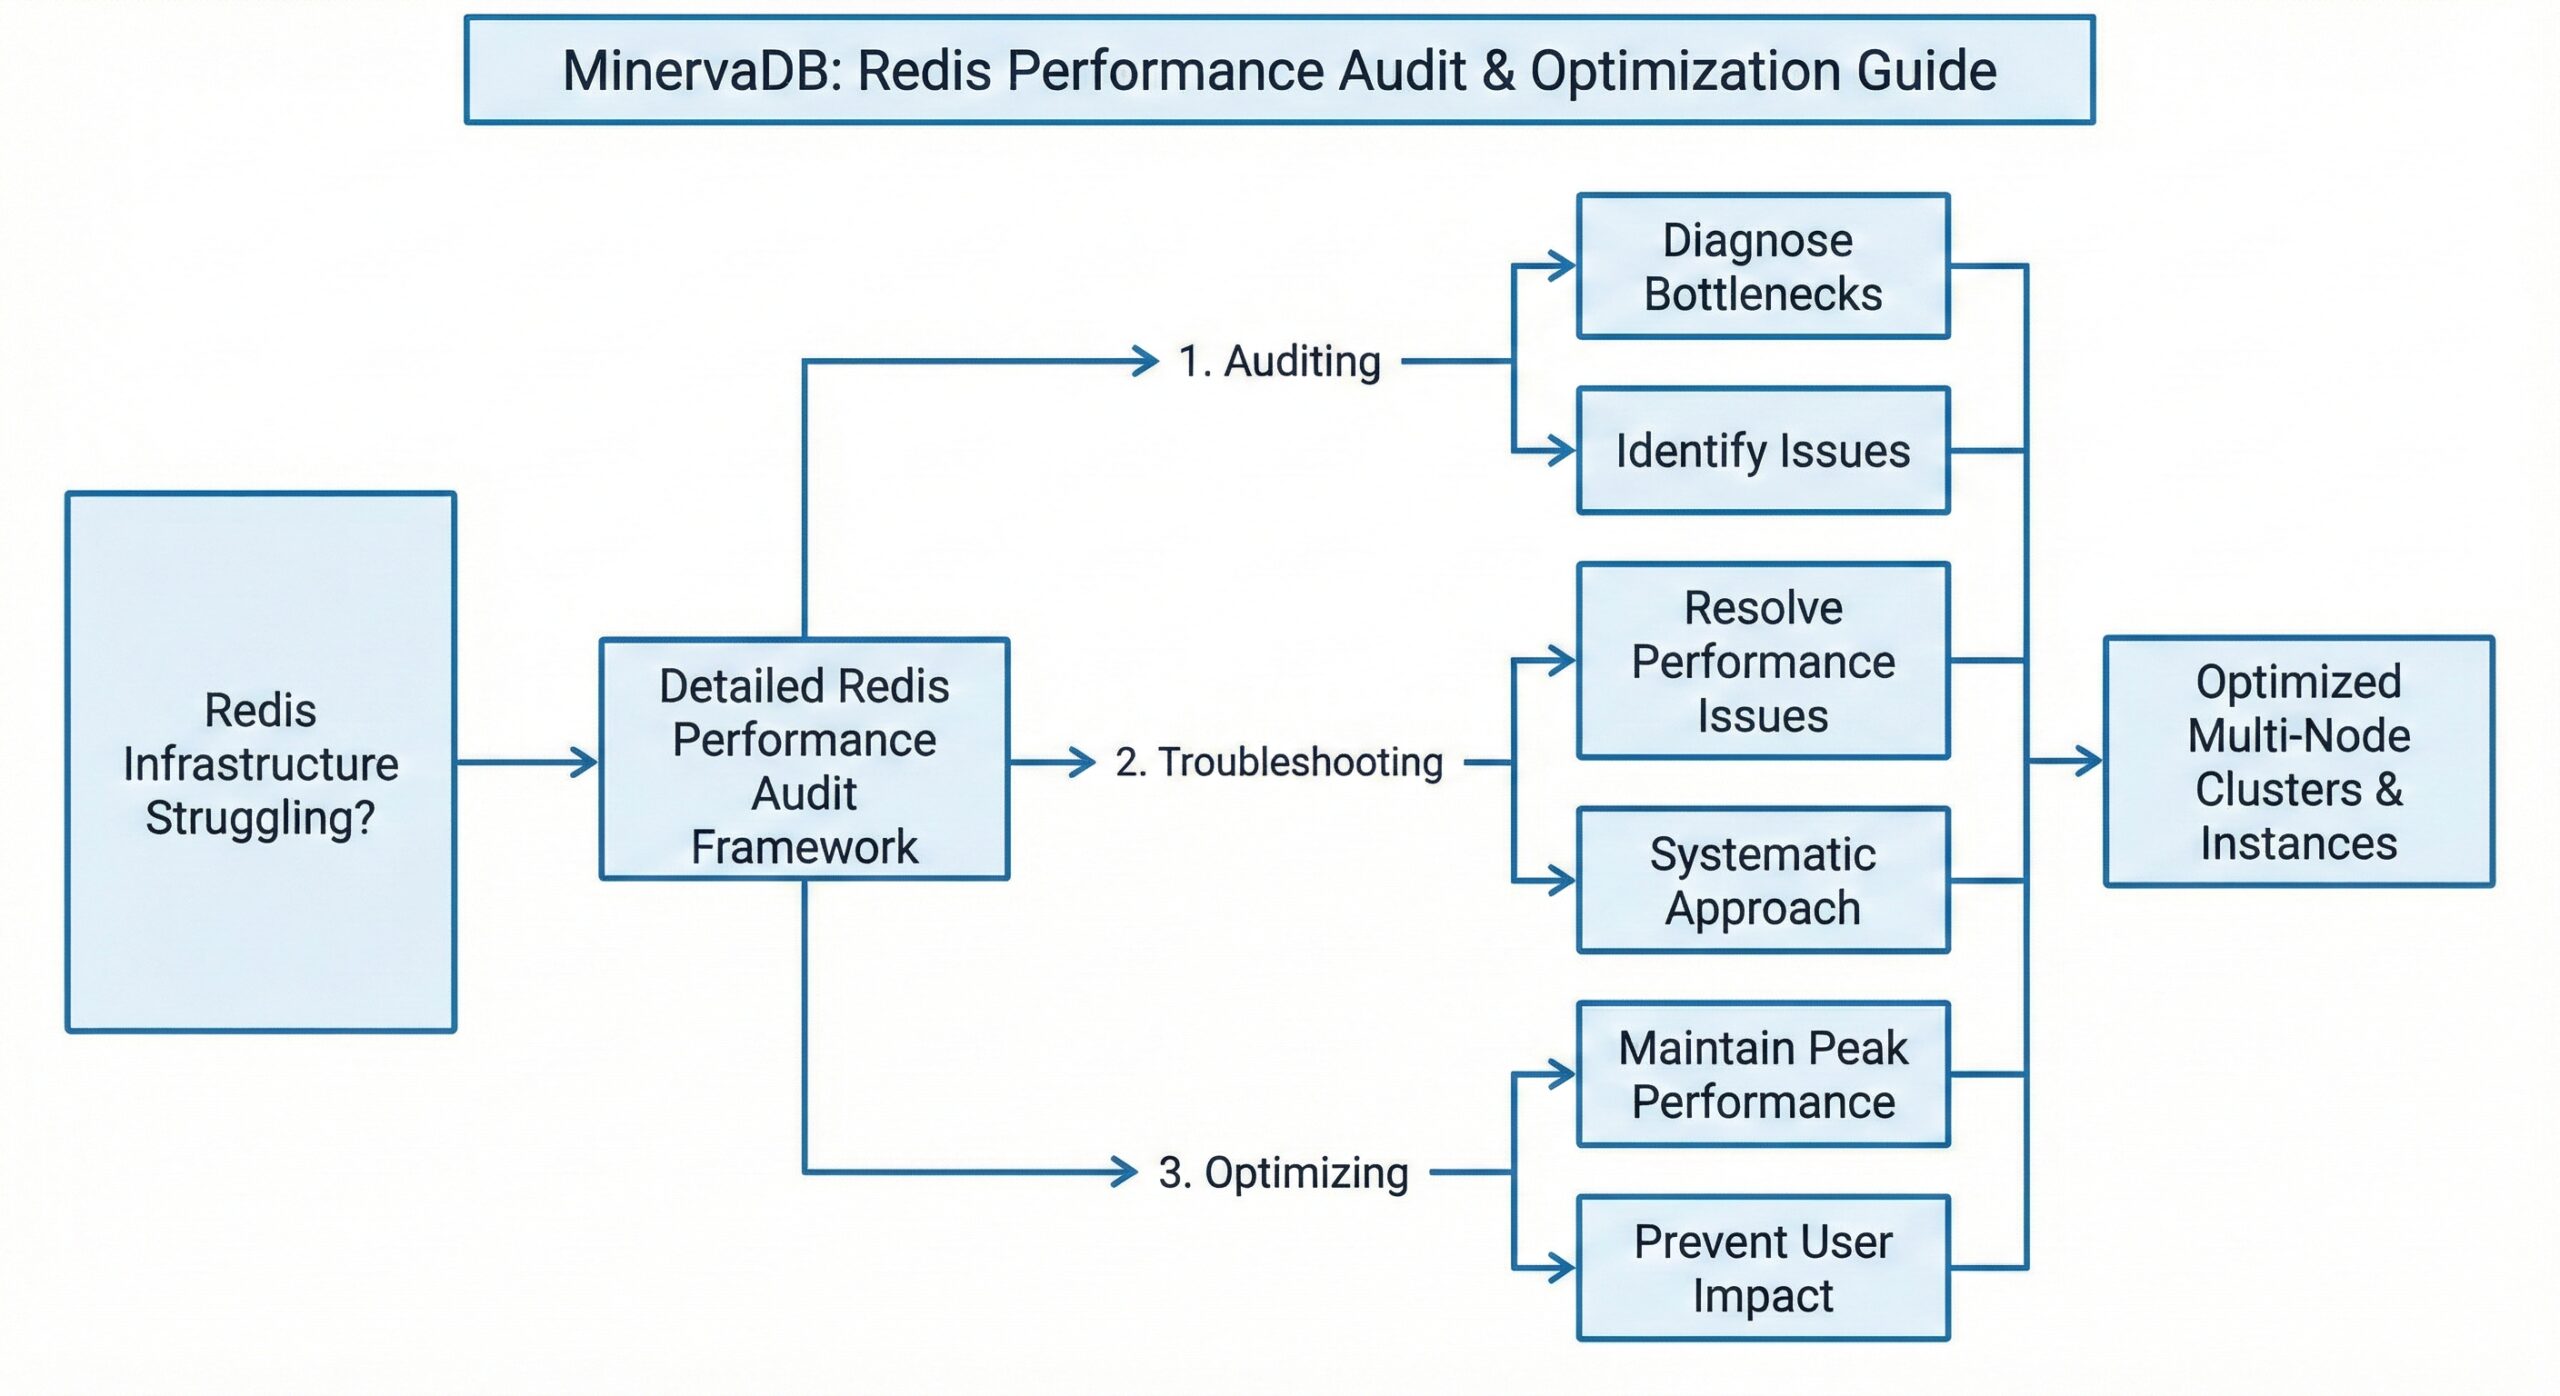
Is your Redis infrastructure struggling with performance issues? Are you looking for a systematic approach to diagnosing and resolving Redis bottlenecks(detailed Redis Performance Audit)? In this comprehensive guide, we’ll walk through a complete framework for auditing, troubleshooting, and optimizing Redis deployments. Whether you’re managing a small Redis instance or a complex multi-node cluster, this step-by-step process will help your team identify problems before they impact users and maintain peak Redis performance. Let’s dive in!
Before diving into performance analysis, you need a clear picture of your Redis environment and proper instrumentation to collect relevant data.
Documenting Your Redis Infrastructure
The first step in any thorough audit is comprehensive documentation:
- Map your topology: Document all Redis instances, clusters, and replicas across your infrastructure
- Configuration inventory: Export and version all Redis configuration files, highlighting non-default settings
- Baseline establishment: Record normal operating parameters during both peak and off-peak hours
Pro Tip: Create an infrastructure diagram showing all Redis nodes, their roles (master/replica), and the applications that connect to them. This visual reference is invaluable during troubleshooting.
Setting Up Metrics Collection
Proper instrumentation is crucial for effective Redis monitoring:
- Deploy Redis exporters for your monitoring system (Prometheus is recommended)
- Enable the slow log with appropriate thresholds (≤1ms during audit periods)
- Configure centralized logging for all Redis nodes with error pattern detection
- Set up network traffic capture for sample traffic analysis periods
Ensuring you have the right data is half the battle in performance troubleshooting. With proper preparation, you’ll be equipped to identify issues quickly and accurately.
Redis Performance Analysis
With your environment documented and metrics flowing, it’s time to analyze Redis performance across three key dimensions.
Command Execution Patterns
Understanding how your applications interact with Redis is crucial:
- Profile command distribution using sampled MONITOR output
- Identify top commands by volume and resource consumption
- Detect anti-patterns like using the KEYS command in production
- Analyze key access distribution to find “hot keys” causing contention
# Sample command to export command stats
redis-cli INFO commandstats > command_stats.txt

# Finding the most used commands
cat command_stats.txt | sort -k3 -nr | head -10
Memory Utilization Deep Dive
Redis is an in-memory database, making memory analysis critical:
- Analyze memory fragmentation ratios and patterns
- Perform keyspace histogram analysis to understand key size distribution
- Identify memory-hungry keys using the MEMORY USAGE command
- Evaluate data structure efficiency and encoding transitions
Memory Optimization Tip: Large hashes, sets, or sorted sets can sometimes be more efficiently stored with different encoding. Check if your large data structures could benefit from hash-max-ziplist-entries tuning.
Network Performance Evaluation
Network issues often masquerade as Redis performance problems:
- Audit connection management patterns across client applications
- Analyze throughput against bandwidth capacity
- Measure network round-trip time contributions to overall latency
- Evaluate impact of network infrastructure like load balancers and proxies
By examining these three key areas, you’ll develop a comprehensive understanding of your Redis performance profile and identify potential bottlenecks.
Reliability Assessment
Performance isn’t just about speed—it’s also about consistency and availability. Let’s examine how to assess Redis reliability.
Availability Analysis
High availability is crucial for production Redis deployments:
- Review Sentinel configuration and behavior (if applicable)
- Analyze cluster failure detection sensitivity and accuracy
- Measure failover duration and success rate in controlled tests
- Evaluate split-brain prevention mechanisms
Persistence Configuration Audit
Data durability requires proper persistence configuration:
- Evaluate RDB snapshot frequency and performance impact
- Analyze AOF write patterns and fsync policy effectiveness
- Measure recovery time from persistence files in test scenarios
- Validate backup procedures and restoration testing protocols
Replication Health Check
For distributed Redis setups, replication health is critical:
- Measure replication lag across all replicas under various loads
- Analyze replication buffer usage during peak traffic
- Test replica promotion processes for reliability
- Monitor partial sync vs. full sync frequency and triggers
Reliability metrics provide crucial context for performance data. A fast Redis instance that frequently goes down or loses data isn’t meeting your business needs.
Forensic Analysis & Diagnostics
When problems occur, you need systematic approaches to identify root causes and resolve issues quickly.
Root Cause Analysis Methodology
Develop procedures for common Redis issues:
- Performance degradation investigation using correlation between symptoms and metrics
- Error pattern analysis to classify and categorize error messages
- Resource leakage detection for slow-building problems
Building Your Redis Diagnostic Toolkit
Custom tools can dramatically improve troubleshooting efficiency:
- Create Redis-specific health check scripts for common issues
- Develop key cardinality monitoring tools to track data growth
- Build command pattern analyzers to detect problematic access patterns
Diagnostic Toolkit Essential: Create a script that captures INFO ALL output, slow log entries, and key statistics in one operation to quickly gather diagnostic information during incidents.
Forensic Capture Procedures
When serious issues occur, evidence preservation is critical:
- Develop memory dump analysis procedures
- Create network traffic capture methodology
- Implement command logging for forensic review
- Document state preservation techniques for post-incident analysis
Having established procedures for diagnostics prevents chaotic troubleshooting during production incidents and leads to faster resolution times.
Optimization Strategies
After identifying performance issues, the next step is implementing optimizations across multiple layers.
Redis Configuration Tuning
Fine-tune Redis parameters based on your workload:
- Optimize maxmemory settings based on actual usage patterns
- Fine-tune eviction policies to match access patterns
- Adjust client timeout and buffer limits to prevent resource exhaustion
- Configure persistence settings for optimal durability/performance balance
Operating System Optimization
Redis performance depends heavily on the underlying OS:
- Tune TCP parameters for Redis workload
- Configure huge pages appropriately (usually disabled for Redis)
- Adjust disk I/O scheduler for AOF/RDB workloads
- Optimize kernel memory management parameters for large instances
# Common sysctl settings for Redis servers
sysctl vm.overcommit_memory=1
sysctl net.core.somaxconn=1024
sysctl vm.swappiness=0
Application-Level Optimizations
Often, the biggest gains come from changing how applications use Redis:
- Redesign problematic data structures for better memory efficiency
- Optimize key naming and organization to improve logical separation
- Replace problematic commands with more efficient alternatives
- Implement pipelining where appropriate to reduce network roundtrips
A holistic optimization approach addressing Redis configuration, OS settings, and application patterns yields the best results.
Continuous Improvement
Performance tuning isn’t a one-time project; it requires ongoing attention and refinement.
Enhanced Monitoring Framework
Evolve your monitoring to catch issues before they impact users:
- Implement an SLI/SLO framework with clear performance objectives
- Deploy histogram-based latency tracking for more accurate performance visibility
- Create proactive alert systems based on trends, not just thresholds
Continuous Performance Testing
Regular testing keeps performance on track:
- Develop a benchmark suite with representative workloads
- Implement chaos engineering to test failure scenarios
- Create peak load simulations to validate capacity planning
Knowledge Management
Capture and share performance knowledge:
- Create operational playbooks for common scenarios
- Build a performance knowledge base documenting patterns and anti-patterns
- Develop training modules for Redis performance tuning
Continuous improvement transforms reactive firefighting into proactive performance management, reducing incidents and improving service quality.
Redis Metrics Reference
Here are the essential Redis metrics to monitor, organized by category:
Memory Metrics
- used_memory
- used_memory_rss
- mem_fragmentation_ratio
- maxmemory
- used_memory_peak
Performance Metrics
- instantaneous_ops_per_sec
- instantaneous_input/output_kbps
- used_cpu_sys/used_cpu_user
- latest_fork_usec
Command Metrics
- cmdstat_* metrics for key commands
- slowlog length and entries
- rejected_connections
- total_commands_processed
Client Metrics
- connected_clients
- blocked_clients
- client_longest_output/input_list
Replication Metrics
- master_repl_offset
- slave_repl_offset
- repl_backlog_active
- master_link_down_since_seconds
Persistence Metrics
- rdb_last_save_time
- rdb_changes_since_last_save
- aof_current_size
- aof_buffer_length
Keyspace Metrics
- db*:keys (number of keys in each database)
- db*:expires (number of keys with expiration)
- expired_keys
- evicted_keys
- keyspace_hits/keyspace_misses
Tracking these metrics over time provides the foundation for performance analysis and capacity planning.
Essential Redis Diagnostic Commands
When troubleshooting, these Redis commands are your best friends:
Memory Analysis
MEMORY DOCTOR
MEMORY USAGE <key>
MEMORY STATS
OBJECT ENCODING <key>
Performance Analysis
INFO all
SLOWLOG GET <count>
CLIENT LIST
LATENCY DOCTOR
Key Analysis
SCAN <cursor> [MATCH pattern] [COUNT count] [TYPE type]
DBSIZE
TTL <key>
Cluster Management
CLUSTER INFO
CLUSTER NODES
CLUSTER SLOTS
Command Safety Tip: Never run KEYS or FLUSHALL/FLUSHDB commands on production Redis instances without understanding the consequences.
Troubleshooting Common Redis Issues
High Memory Fragmentation
Symptoms: mem_fragmentation_ratio > 1.5 Solutions:
- Restart instance during low traffic periods
- Enable active defragmentation (Redis 4.0+)
- Adjust maxmemory settings
Latency Spikes
Symptoms: Sudden increases in command response time Solutions:
- Check for disk operations (AOF/RDB)
- Review slow log entries
- Examine neighbors on shared hardware
- Disable expensive commands during peak hours
Replication Lag
Symptoms: Growing difference between master and replica offsets Solutions:
- Check network bandwidth between nodes
- Reduce write load during peak times
- Consider scaling replica hardware
- Optimize disk I/O on replicas
Connection Storms
Symptoms: Rapid increases and decreases in connected_clients Solutions:
- Implement proper connection pooling in clients
- Adjust tcp-keepalive settings
- Review timeout handling in client applications
Hot Keys
Symptoms: Specific keys accessed at very high frequency causing contention Solutions:
- Implement key sharding techniques
- Cache frequently accessed values in application memory
- Use Redis Cluster to distribute hot keys
Each of these common issues has distinct patterns and solutions. Recognizing these patterns early can prevent small problems from becoming major outages.
Conclusion
Redis performance optimization is both an art and a science. By following this comprehensive audit framework, you can systematically identify issues, implement improvements, and maintain peak performance for your Redis infrastructure.
Remember that Redis performance tuning is not a one-time task but an ongoing process. Regular audits, continuous monitoring, and proactive optimization will keep your Redis deployment running smoothly as your applications evolve and your data grows.
Need help with your Redis performance issues? Our team of Redis experts can conduct a thorough audit of your deployment and provide tailored recommendations. Contact us to learn more about our Redis optimization services.
FAQs
Q: How often should I conduct a Redis performance audit?
A: For production environments, conduct comprehensive audits quarterly and mini-audits monthly. Additionally, perform an audit after any significant application changes or traffic pattern shifts.
Q: What’s the most common Redis performance issue you encounter?
A: Memory fragmentation is among the most common issues, particularly in long-running instances with volatile key patterns. Regular monitoring of the fragmentation ratio can help catch this early.
Q: Should I use Redis Cluster or Sentinel for high availability?
A: It depends on your use case. Redis Cluster provides both high availability and data sharding, while Sentinel focuses solely on high availability. For large datasets that exceed single instance capacity, Cluster is preferred.
Q: What’s the optimal maxmemory-policy for a cache workload?
A: For pure cache workloads, allkeys-lru typically provides the best performance. If you have some keys that should never be evicted, consider volatile-lru instead.
Q: How can I identify which clients are sending problematic commands?
A: Use the CLIENT LIST command to view all connected clients and their statistics. For more detailed analysis, enable the Redis slow log and use the SLOWLOG GET command to see which clients are generating slow commands.
Further Reading
- Data Strategy and Analytics from MinervaDB
- Emergency DBA Support from MinervaDB
- ChistaDATA University
- PostgreSQL DBA Support
- Troubleshooting PostgreSQL Performance
